Rationalize Your Application Portfolio
Establish an evergreen application portfolio management (APM) program to deliver the best possible return on investment.
When organizations consider application oversight a low priority and app portfolio knowledge is poor:
- No dedicated or centralized effort to manage the app portfolio means no single source of truth is available to support informed decision-making.
- Organizations acquire more applications over time, creating redundancy, waste, and the need for additional support.
- Organizations are more vulnerable to changing markets. Flexibility and growth are compromised when applications are unadaptable or cannot scale.
Our Advice
Critical Insight
- You cannot outsource application strategy.
- Modern software options have lessened the need for organizations to have robust in-house application management capabilities. But your applications’ future and governance of the portfolio still require centralized oversight to ensure the best overall return on investment.
- Application portfolio management is the mechanism to ensure that the applications in your enterprise are delivering value and support for your value streams and business capabilities. Understanding value, satisfaction, technical health, and total cost of ownership are critical to digital transformation, modernization, and roadmaps.
Impact and Result
Build an APM program that is ready for action and fit for size:
- Understand your current state, needs, and goals for your application portfolio management.
- Create an application and platform inventory that is built for better decision making.
- Rationalize your apps with business priorities and communicate risk in operational terms.
- Create a roadmap that improves communication between those who own, manage, and support your applications.
Member Testimonials
After each Info-Tech experience, we ask our members to quantify the real-time savings, monetary impact, and project improvements our research helped them achieve. See our top member experiences for this blueprint and what our clients have to say.
9.4/10
Overall Impact
$219,951
Average $ Saved
29
Average Days Saved
Client
Experience
Impact
$ Saved
Days Saved
CELL THERAPY CATAPULT LIMITED
Guided Implementation
10/10
$184K
3
Dimuth was a pleasure to work with and gave very clear oversight and experience on how to understand our business and the task in hand. Looking fo... Read More
Habib Canadian Bank
Guided Implementation
10/10
N/A
20
SYNLAB Services S. L.
Guided Implementation
10/10
$15,899
32
Dimuth took us through the APM framework but understood our needs and worked with us on actual data to produce an outcome.
EP Commodities B.V.
Guided Implementation
10/10
$15,899
5
CAA Saskatchewan
Guided Implementation
9/10
$14,500
5
Carver County, MN
Guided Implementation
9/10
$4,080
5
Clark Atlanta University
Guided Implementation
8/10
N/A
N/A
I am not quite sure yet on the amounts but I am certain that the relationship will create increased productivity and reduced costs on our side. I ... Read More
Montana Department of Transportation
Guided Implementation
10/10
$272K
47
Flexible on scheduling - worked with our needs, very good knowledge of the spreadsheet and the related processes. Very good guidance on applicable ... Read More
Sutton Place Limited
Guided Implementation
10/10
$34,000
N/A
While the initial application scoring setup required a meaningful time investment to tailor the methodology to our organization and industry, that ... Read More
Fernco Inc
Workshop
10/10
$816K
90
Best. Venkat being able to provide context , examples, and issues that are impacted by the application Rationalization workshop results. Worst. ... Read More
East Bay Municipal Utility District
Guided Implementation
9/10
N/A
N/A
Hans was very helpful in walking me through the blueprint and potential approach to a guided implementation. His time with Stan in previous convers... Read More
Social Sciences and Humanities Research Council
Workshop
9/10
$50,000
20
Overall, we think the workshop was valuable and we appreciate Infotech fulfilling the workshop credits. Paul H is a great facilitator with a lot o... Read More
BRP Group
Guided Implementation
8/10
$13,600
2
City of St Albert
Workshop
8/10
$95,000
20
Very informative and well delivered. Paul did a great job getting and keeping the group engaged.
Mahoning County
Guided Implementation
10/10
$27,880
20
The experience opened my eyes to applications that were running as shadow IT, and application overlap. This will lead to cost savings both in appli... Read More
Carver County, MN
Guided Implementation
9/10
$6,800
5
University of Tasmania
Guided Implementation
10/10
$9,000
5
Only best parts :) Identified an approach to engage Deloitte on our terms not Deloitte's terms when it comes to price and terms and conditions. Wo... Read More
Colonial Pipeline Company
Workshop
10/10
$1.36M
10
Great workshop, great interaction from Hans with our business team. Little resistance from business teams about providing information. We had a... Read More
APEGA
Workshop
9/10
$90,000
20
Best: alignment on method amongst our team; some good progress on developing the roadmap Worst: emergent strategic plan not yet published at APE... Read More
La Trobe University
Guided Implementation
8/10
$45,000
35
Easy to talk to both Ricardo and James understood what we need, James was able to connect a few points back to other Aus uni similar challenges/exp... Read More
County Of Rockdale
Guided Implementation
10/10
$51,000
115
The knowledge and expertise the counselor.
Southern Illinois University – Carbondale Office of Information Technology
Guided Implementation
10/10
$13,600
10
The initial call is always sipping from a firehose. We can see that App Rationalization is a significant undertaking and anticipate it will help u... Read More
Goodwill of Central and Northern Arizona
Workshop
8/10
$68,000
N/A
Oregon Public Utility Commission
Workshop
10/10
$2,720
5
Asia is a great facilitator with a wealth of information for my team. We enjoyed working with her during this engagement.
PBI Gordon Companies, Inc
Guided Implementation
10/10
$34,000
10
Orange County, NC
Guided Implementation
8/10
$13,600
10
Regional Transportation District
Guided Implementation
9/10
$1.22M
80
Hans plays a crucial role in driving positive change and enhancing IT maturity, delivering tangible results. InfoTech, as a whole, provides excepti... Read More
Northland Power Inc
Guided Implementation
8/10
$100K
20
It was a lot of information in one shot but Kieran was very helpful in clarifying my questions and requests.
Governor’s Office of Land Use and Climate Innovation
Guided Implementation
10/10
$136K
20
Best: The engagement met 100% of my expectations. My team was able to implement the guidance and learning in real time with the analyst. Worst:... Read More
Carver County, MN
Guided Implementation
10/10
$2,584
5

Application Portfolio Management
Support your ongoing business objectives with a rationalized application portfolio while remaining aligned with your current and future technology needs.
This course makes up part of the Applications Certificate.
- Course Modules: 6
- Estimated Completion Time: 1 hour
Workshop: Rationalize Your Application Portfolio
Workshops offer an easy way to accelerate your project. If you are unable to do the project yourself, and a Guided Implementation isn't enough, we offer low-cost delivery of our project workshops. We take you through every phase of your project and ensure that you have a roadmap in place to complete your project successfully.
Module 1: Lay Your Foundations
The Purpose
- Work with key corporate stakeholders to come to a shared understanding of the benefits and aspects of application portfolio management.
Key Benefits Achieved
- Establish the goals of APM.
- Set the scope of APM responsibilities.
- Establish business priorities for the application portfolio.
Activities
Outputs
Assess your current application portfolio
- An understanding of your current application portfolio
Determine narrative
- Current narrative for why we need to rationalize our application portfolio
Define goals and metrics
- Set short- and long-term goals and metrics
Define application categories
- List of application categories
Determine steps and roles
- A list of steps and roles for your rationalization program
Module 2: Improve Your Inventory
The Purpose
- Gather information on your applications to build a detailed inventory and identify areas of redundancy.
Key Benefits Achieved
- Populated inventory based on your and your team’s current knowledge.
- Understanding of outstanding data and a plan to collect it.
Activities
Outputs
Populate inventory
- Initial application inventory
Assign to business capabilities
- Alignment of inventory to business capabilities
Module 3: Rationalize Your Applications
The Purpose
Work with the application subject matter experts to collect and compile data points and determine the appropriate disposition for your apps.
Key Benefits Achieved
- Dispositions for individual applications
- Application rationalization framework
Activities
Outputs
Assess business value
- Business value score for individual applications
Assess technical health
- Technical health score for individual applications
Assess end-user perspective
- End-user satisfaction score for individual applications
Assess total cost of ownership
- Assessed TCO for individual applications
Module 4: Populate Your Roadmap
The Purpose
- Work with application delivery specialists to determine the strategic plans for your apps and place these in your portfolio roadmap.
Key Benefits Achieved
- Prioritized initiatives
- Initial application portfolio roadmap
- Ongoing structure of APM
Activities
Outputs
Review APM Snapshot results
- A clear view of areas to focus on
Review Rationalization results
- A view of recommended dispositions and priorities for your applications
Determine dispositions
- Confirmed set of dispositions for your applications
Assess redundancies (optional)
- Identified set of redundant applications
Determine dispositions for redundant applications (optional)
- Dispositions for redundant applications
Prioritize initiatives
- Prioritized new potential initiatives
Determine ongoing cadence
- Established an ongoing cadence of activities
Rationalize Your Application Portfolio
Establish an evergreen Application Portfolio Management (APM) program to deliver the best possible return on investment.
Analyst Perspective
You can’t outsource accountability.
Many lack visibility into their overall application portfolio, focusing instead on individual projects or application development. Inevitably, application sprawl creates process and data disparities, redundant applications, and duplication of resources, and it stands as a significant barrier to organizational agility and responsiveness. The shift from strategic investment to application maintenance creates an unnecessary constraint on innovation and value delivery.
With the rise and convenience of SaaS solutions, IT has an increasing need to discover and support all applications in the organization. Unmanaged and unsanctioned applications can lead to increased reputational risk. What you don’t know will hurt you.
You can outsource development, you can even outsource maintenance, but you cannot outsource accountability for the portfolio. Organizations need a holistic dashboard of application performance and dispositions to help guide and inform planning and investment discussions. Application portfolio management (APM) can’t tell you why something is broken or how to fix it, but it is an important tool to determine if an application’s value and performance are up to your standards and can help meet your future goals.

Hans Eckman
Principal Research Director
Info-Tech Research Group
Executive Summary
Your Challenge | Common Obstacles | Info-Tech’s Approach |
|---|---|---|
|
| Leverage APM to drive application rationalization goals:
|
Info-Tech Insight: You can’t outsource strategy.
Modern software options have decreased the need for organizations to have robust in-house application management capabilities. Your applications’ future and governance of the portfolio still require centralized IT oversight to ensure the best return on investment.
What is application portfolio management (APM)?
Application Inventory
The artifact that documents and informs the organization of your application portfolio.
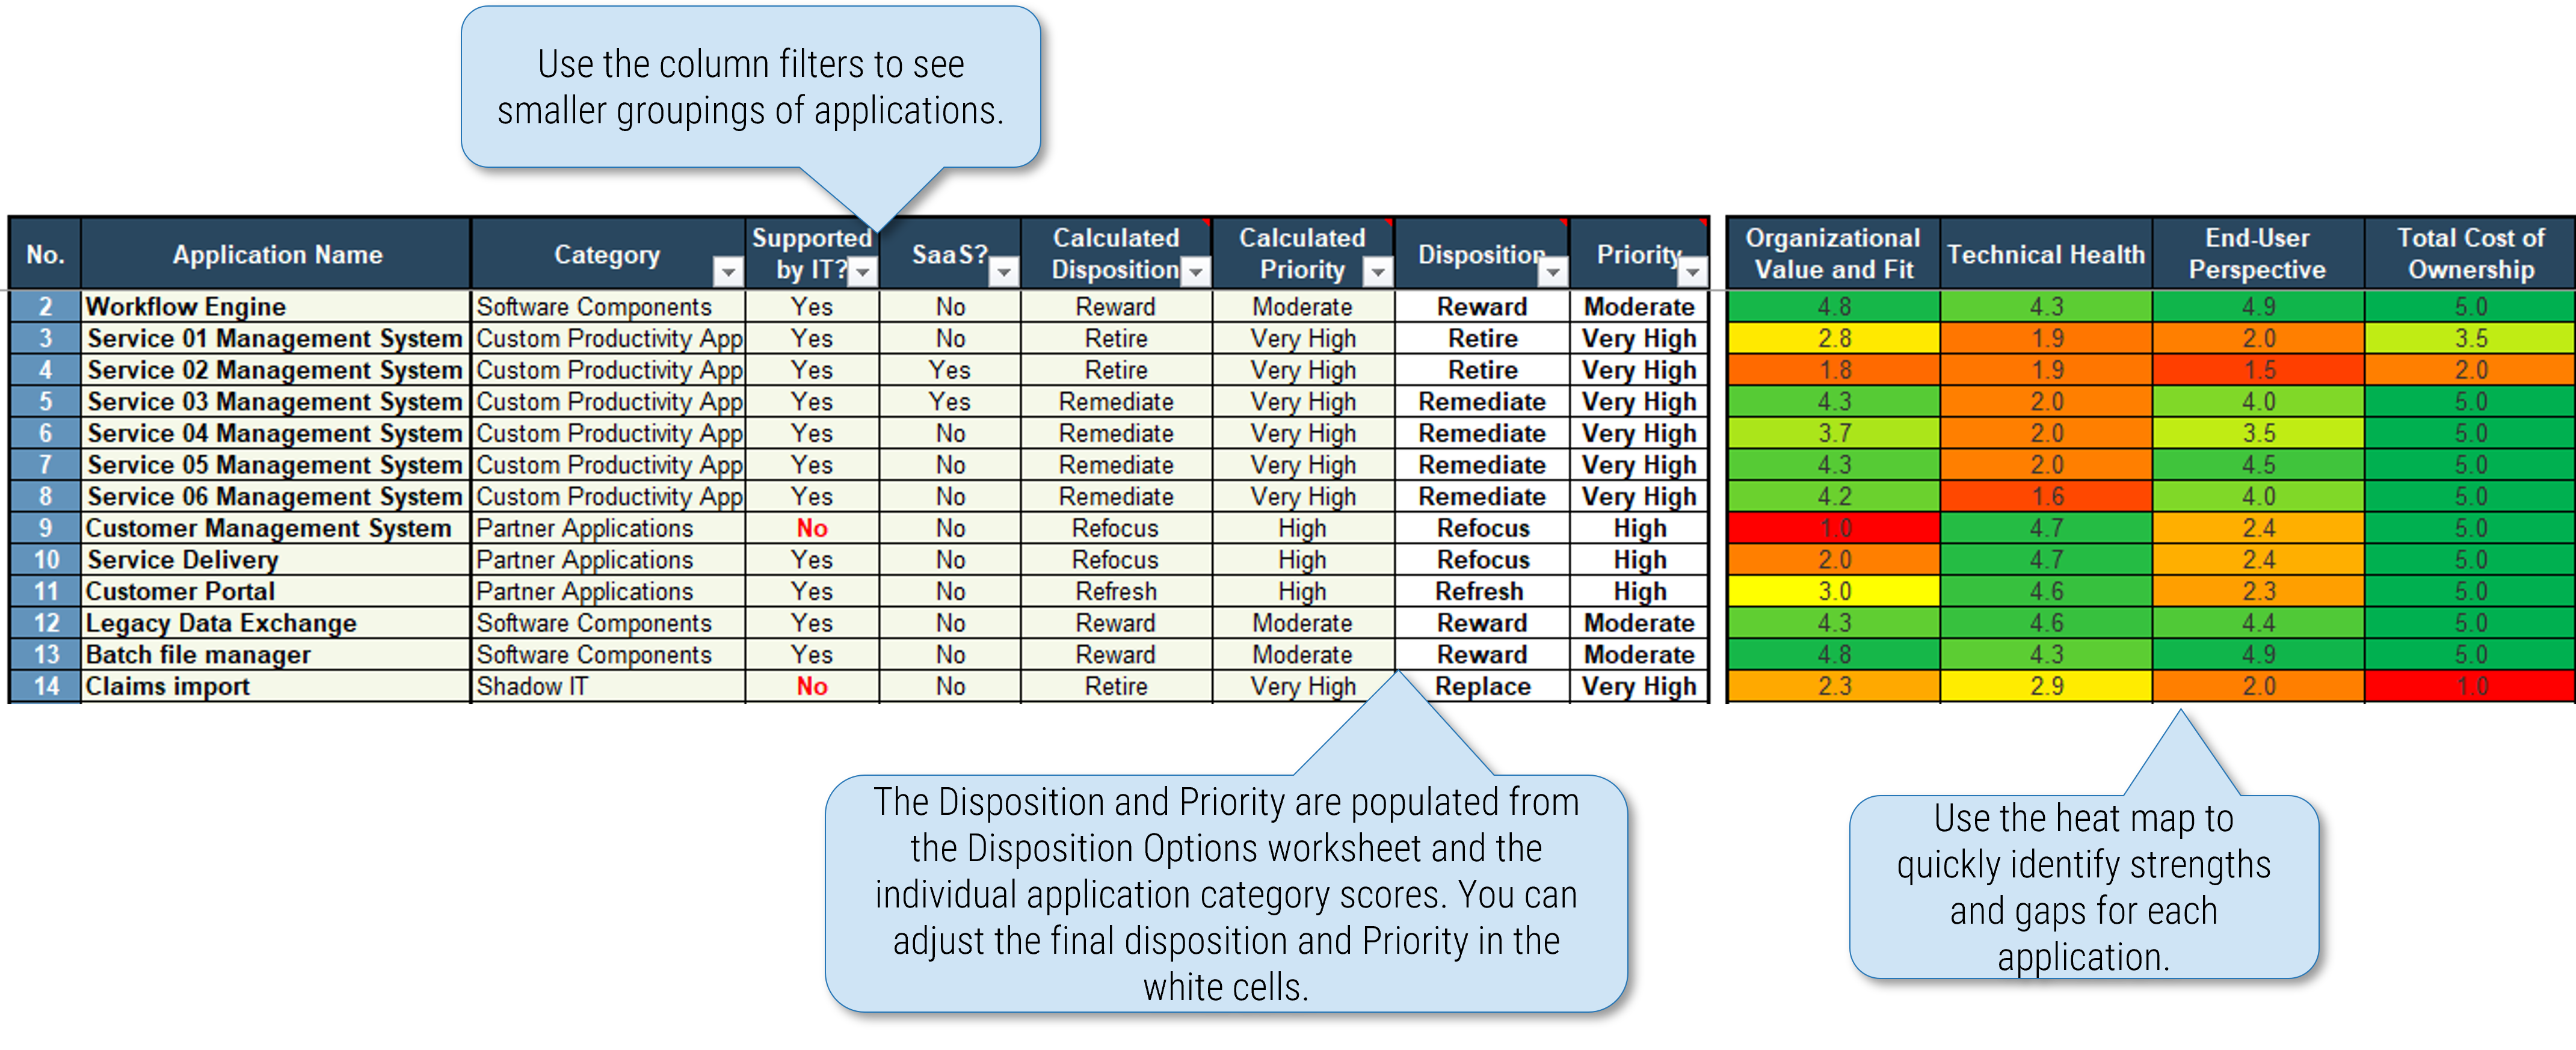
Application Rationalization
The process of collecting information and assessing your applications to determine recommended dispositions.
Application Alignment
The process of revealing application information through interviewing stakeholders and aligning to organizational capabilities.
Application Roadmap
The artifact that showcases the strategic directions for your applications over a given timeline.
Application portfolio management:
The ongoing practice of:
- Providing visibility into applications across the organization
- Recommending corrections or enhancements to decision makers
- Aligning delivery teams on priority
- Showcasing the direction of applications to stakeholders
Is this research right for you?
Research Navigation
Managing your application portfolio is essential regardless of its size or whether your software is purchased or developed in house. Each organization must have some degree of application portfolio management to ensure that applications deliver value efficiently and that their risk or gradual decline in technical health is appropriately limited.
Your APM goals | If this describes your primary goals |
|---|---|
|
|
|
|
|
|
|
|
Create a balanced approach to value delivery
Enterprise Agility and Value Realization
Product Lifecycle Management
Align your product and service improvement and execution to enterprise strategy and value realization in three key areas: defining your products and services, aligning product/service owners, and developing your product vision.
- Make the Case for Product Delivery
- Deliver on Your Digital Product Vision
- Mature and Scale Product Ownership
Product Delivery Lifecycle (Agile DevOps )
Enhance enterprise agility by leveraging an Agile mindset and continuously improving your delivery throughput, quality, value realization, and adaptive governance.
- Agile/DevOps Research Center
- Develop Your Agile Approach for a Successful Transformation
- Implement DevOps Practices That Work
- Define the Role of Project Management in Agile and Product-Centric Delivery
Application Portfolio Management (We're here)
Transform your application portfolio into a cohesive service catalog aligned to your business capabilities by discovering, rationalizing, and modernizing your applications while improving application maintenance, management, and reuse.
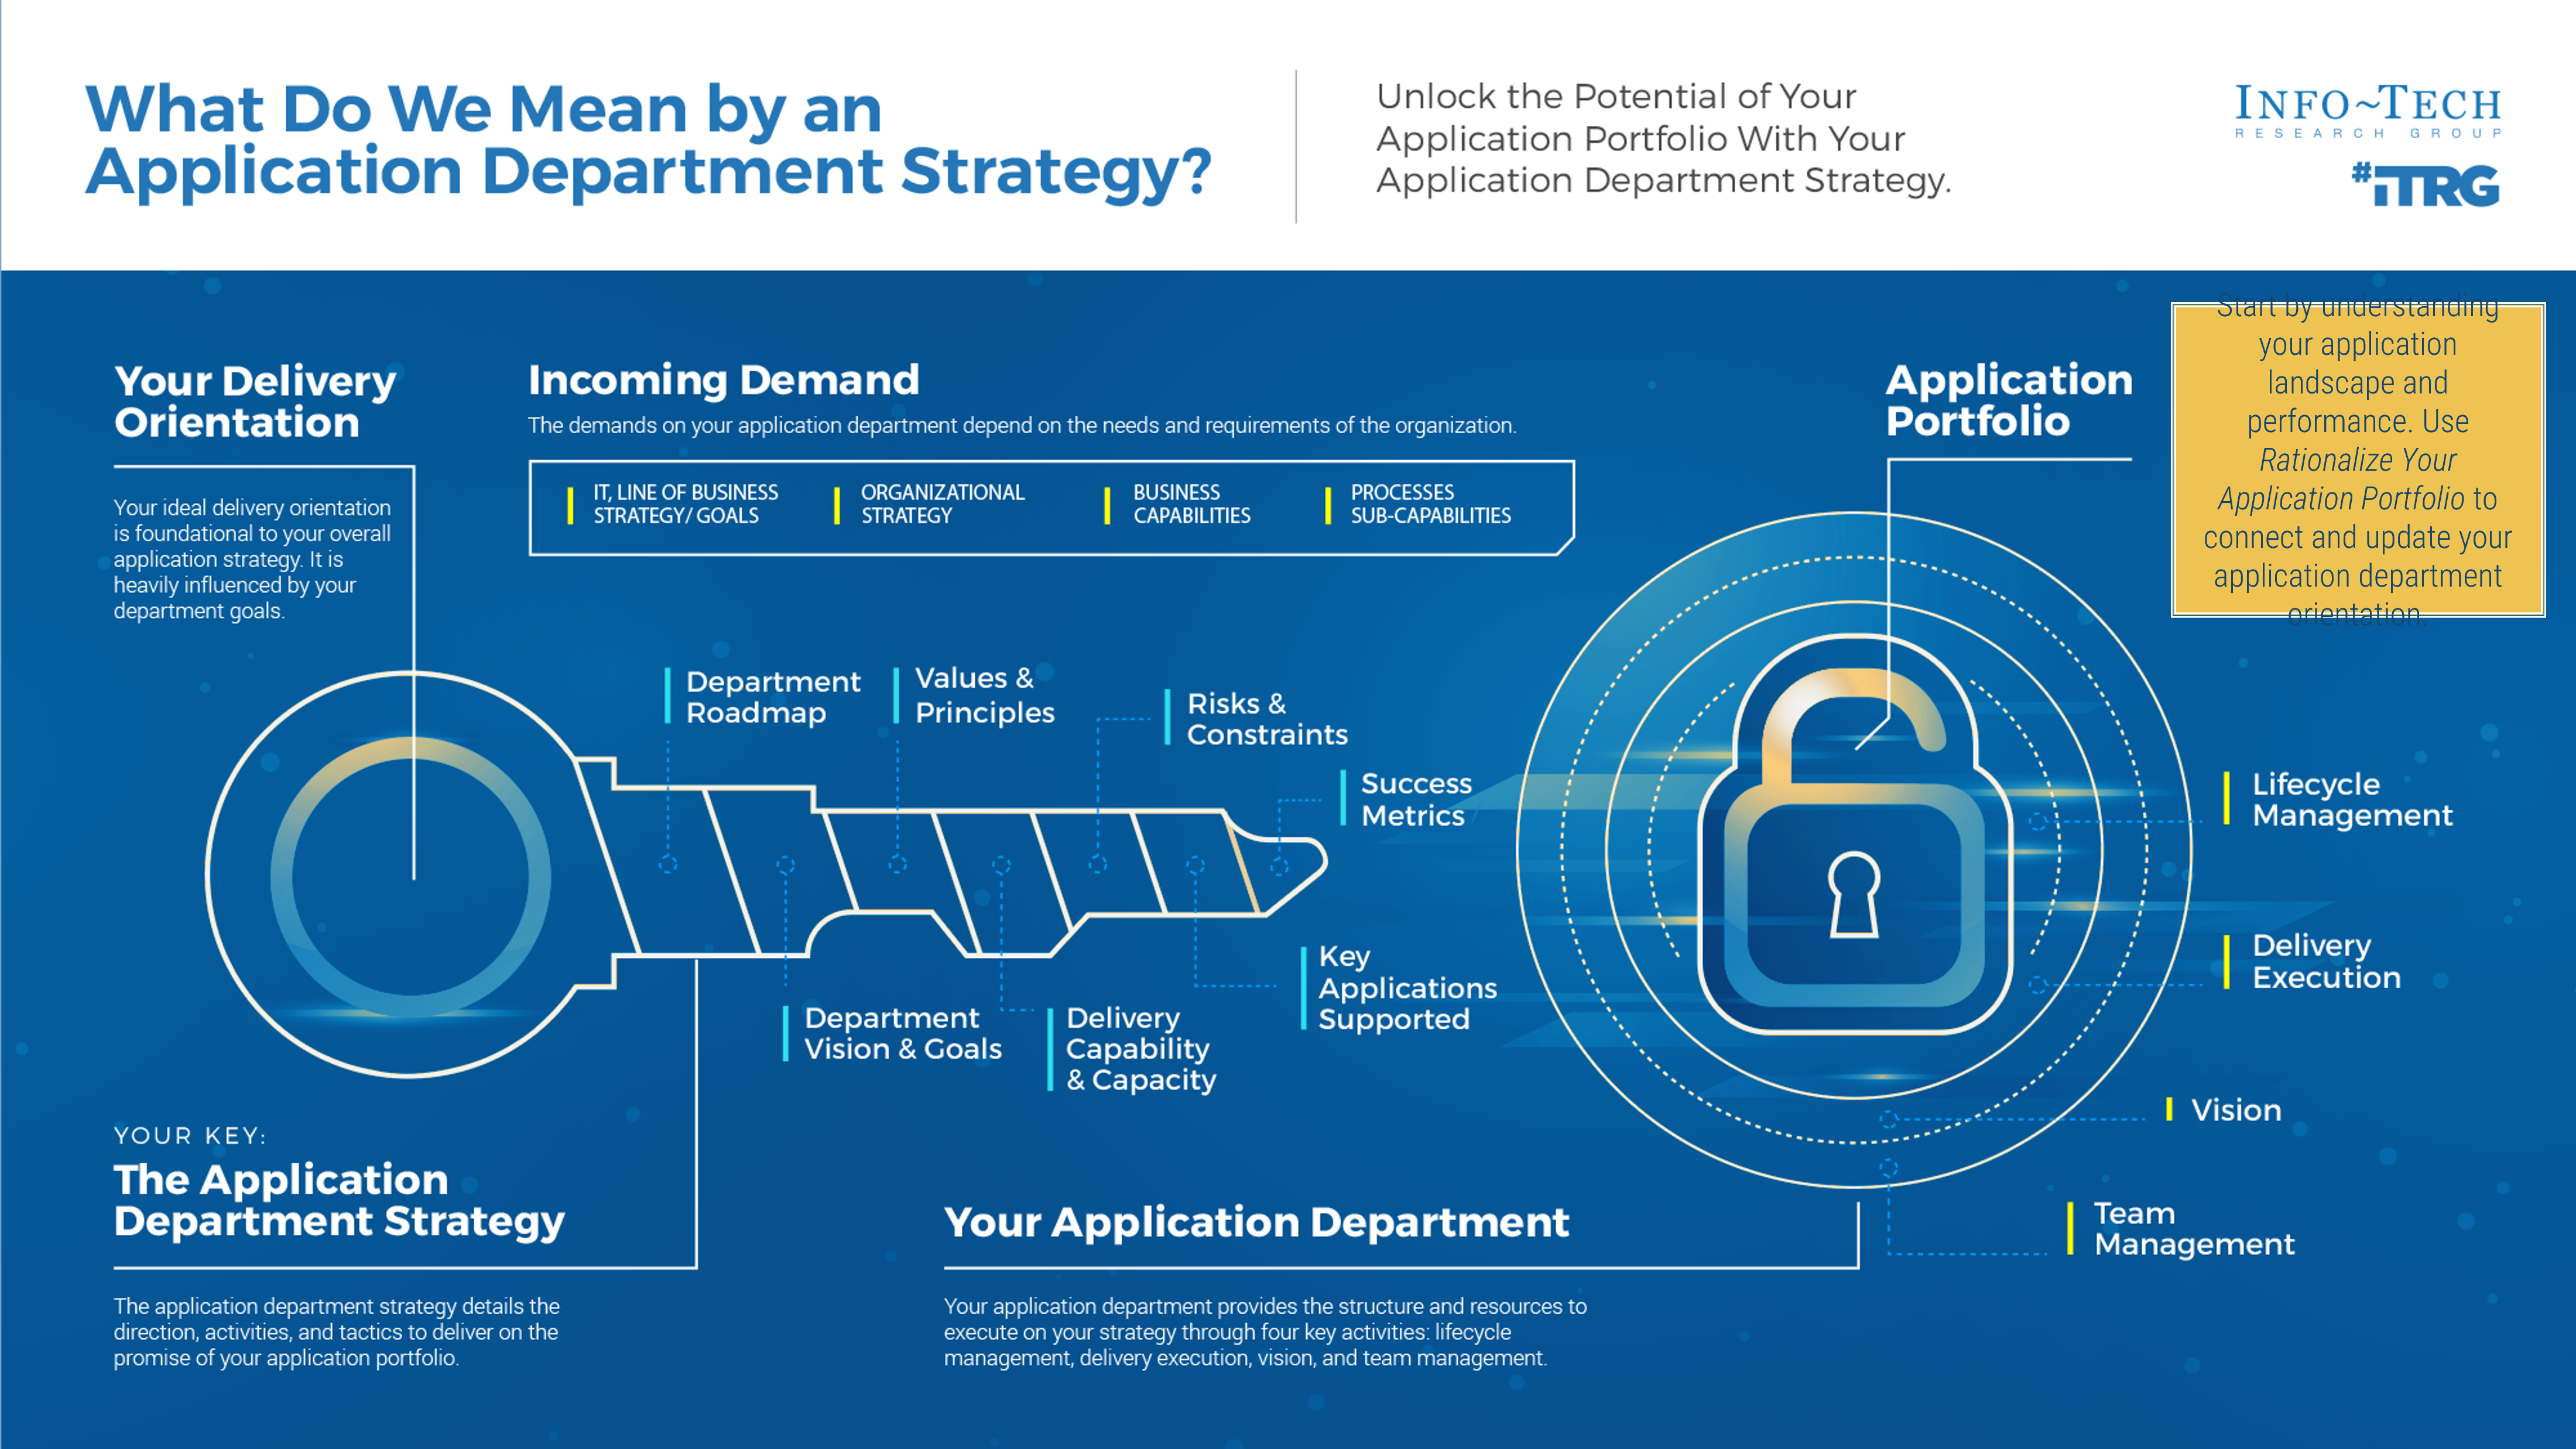
For more information, download Build an Application Department Strategy.
APM comes at a justified cost
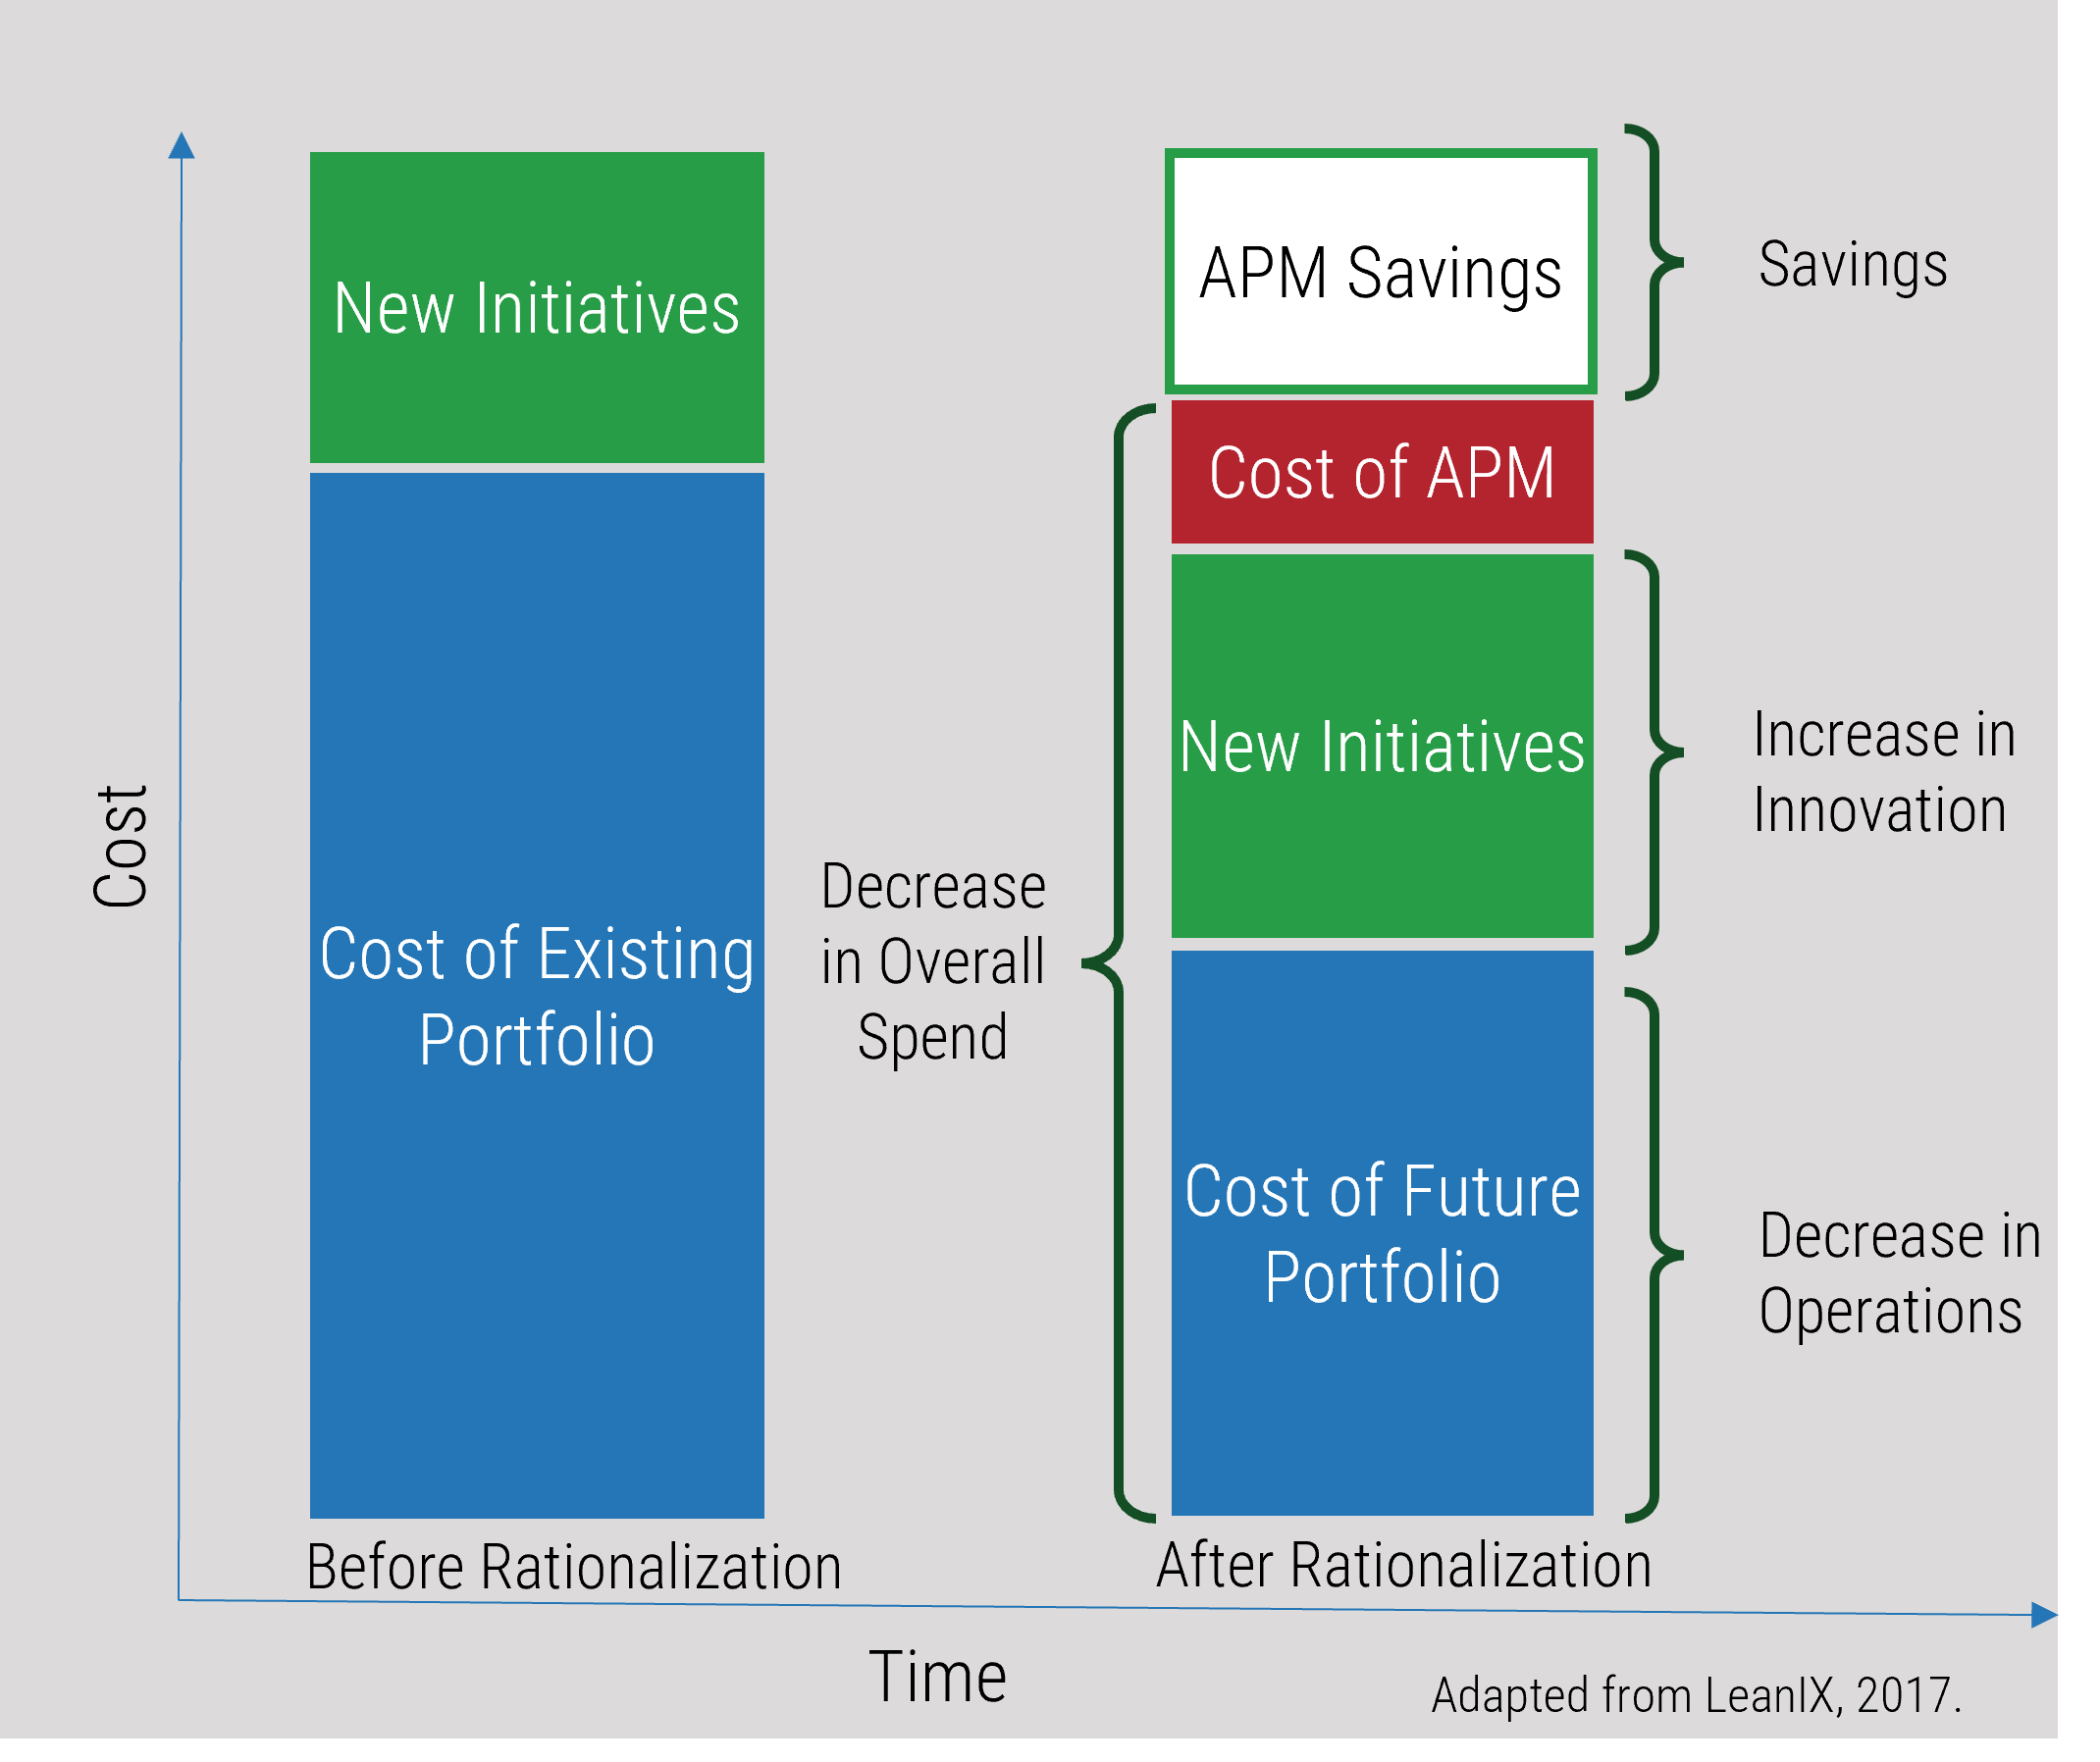
The benefits of APM
APM identifies areas where you can reduce core spending and reinvest in innovation initiatives.
Other benefits can include:
- Fewer redundancies
- Less risk
- Less complexity
- Improved processes
- Flexibility
- Scalability
APM can be even harder for small enterprises and siloed IT
Having more applications than an organization needs means unnecessarily high costs and additional burden on the teams that support the applications. Especially in the case of small enterprises, this is added pressure the IT team cannot afford.
A poorly maintained portfolio will eventually hurt the organization more than it hurts IT.
Legacy systems, complex environments, or anything that leads to a portfolio that can’t adapt to changing organizational needs will eventually become a barrier to organizational growth and accomplishing objectives. Often the blame is put on the IT department.
#1 challenge small enterprise owners face in their use of technology: | |
|---|---|
Taking appropriate security precautions | 24% |
The costs of needed upgrades to technology | 17% |
The time it takes to fix problems | 17% |
The cost of maintaining technology | 14% |
Lack of expertise | 9% |
Breaks in service | 7% |
56% of small businesses cited inflexible technology as a barrier to growth.
Source: Salesforce as quoted by Tech Republic, 2019.
A hidden and inefficient application portfolio is the root cause of so many pains experienced by both IT and the organization:
- Demand/capacity imbalance
- Overspending
- Security and business continuity risk
- Delays in delivery
- Barriers to growth
Every organization experiences some degree of application sprawl
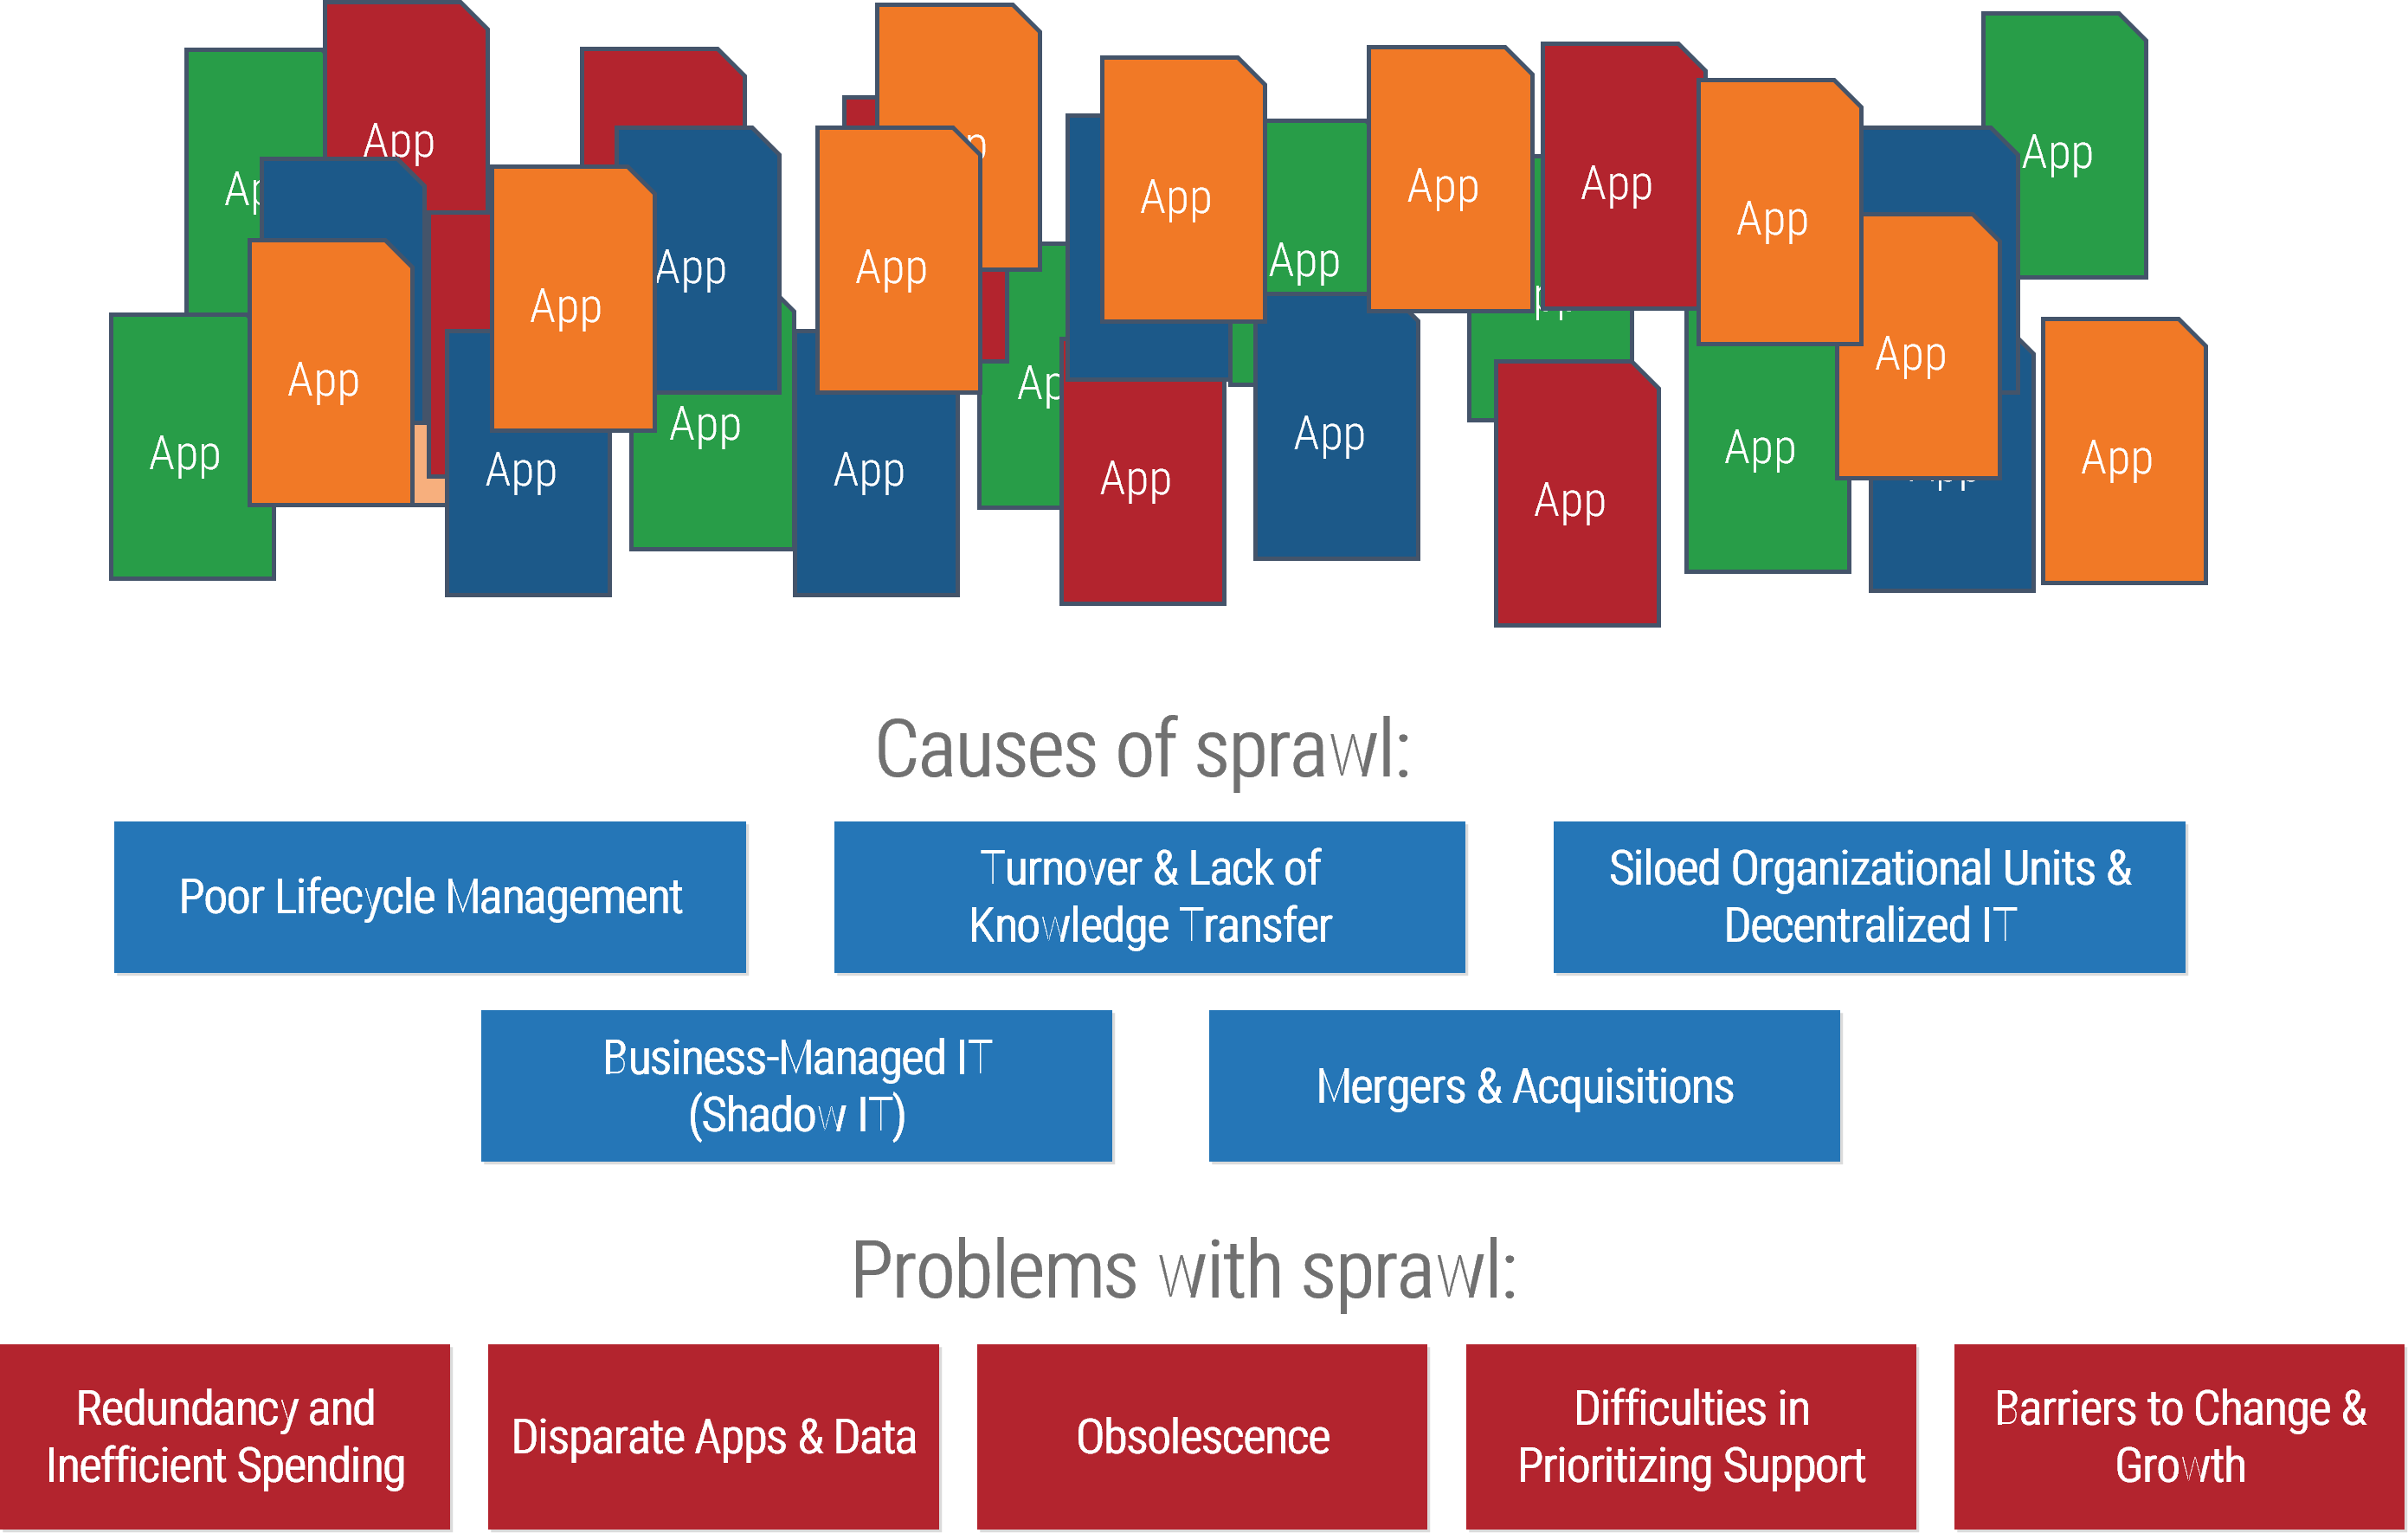
Application sprawl:
Inefficiencies within your application portfolio are created by the gradual and non-strategic accumulation of applications.
You have more apps than you need.
80% of CIOs/CEOs are misaligned on the target role for IT.
Source: Info-Tech’s CEO-CIO Alignment Survey (N=124)
Build your APM journey map
Application rationalization provides insight
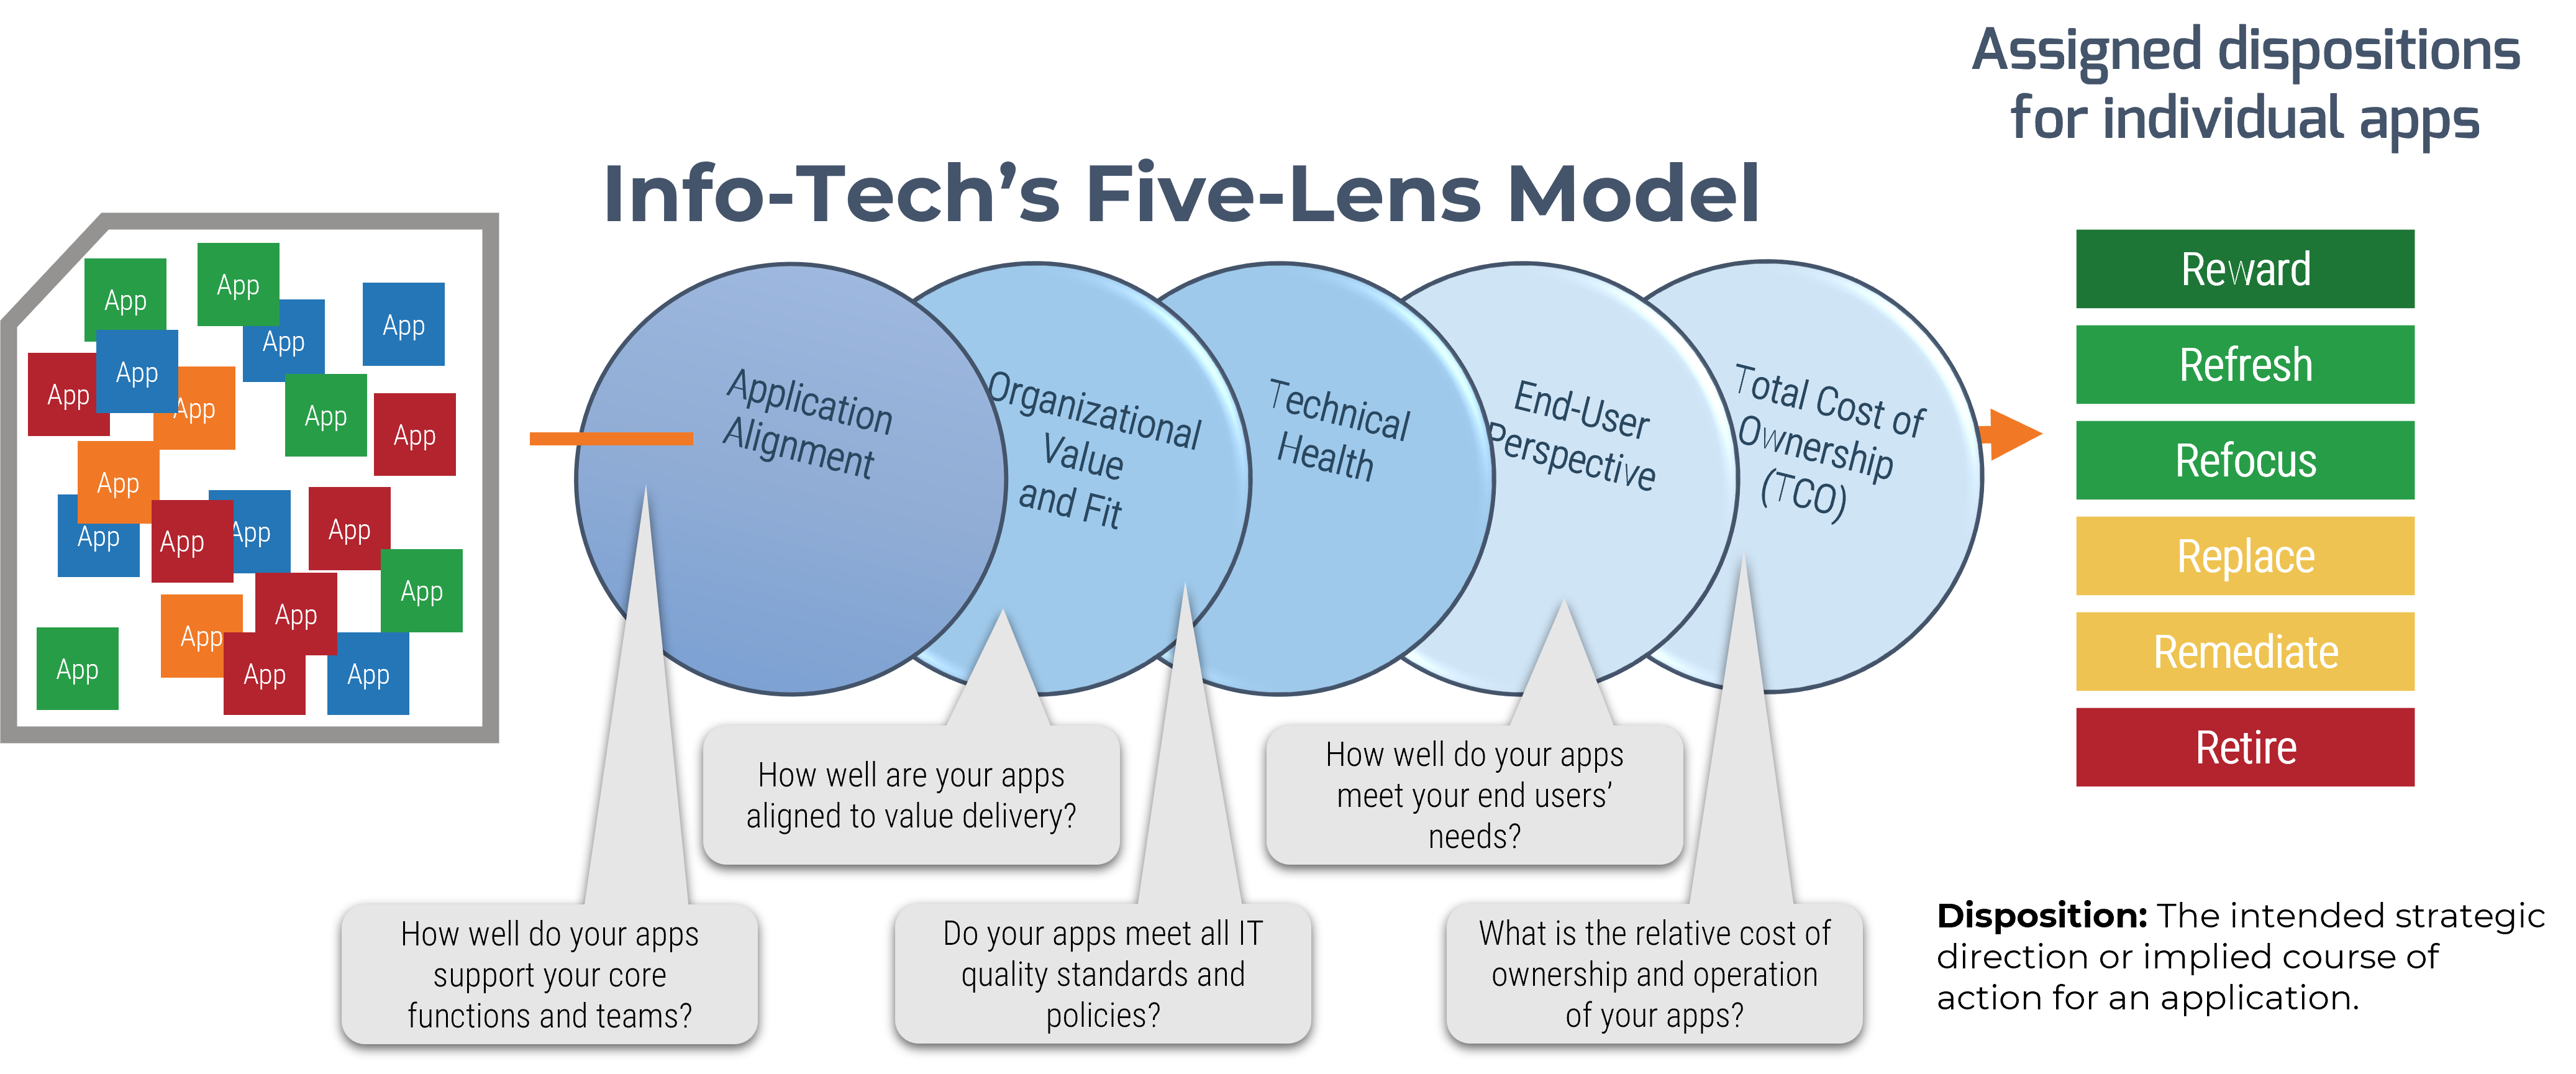
Application rationalization requires the collection of several data points that represent these perspectives and act as the criteria for determining a disposition for each of your applications.
Right-size rationalization for small businesses, educational, and government
Small/medium businesses, educational institutions, and government agencies may not need the same level of rationalization criteria. For faster results, Info-Tech’s APM tool can be adjusted to start with Organizational Value/Fit and Technical Health, with end-user criteria combined into Organizational Value.
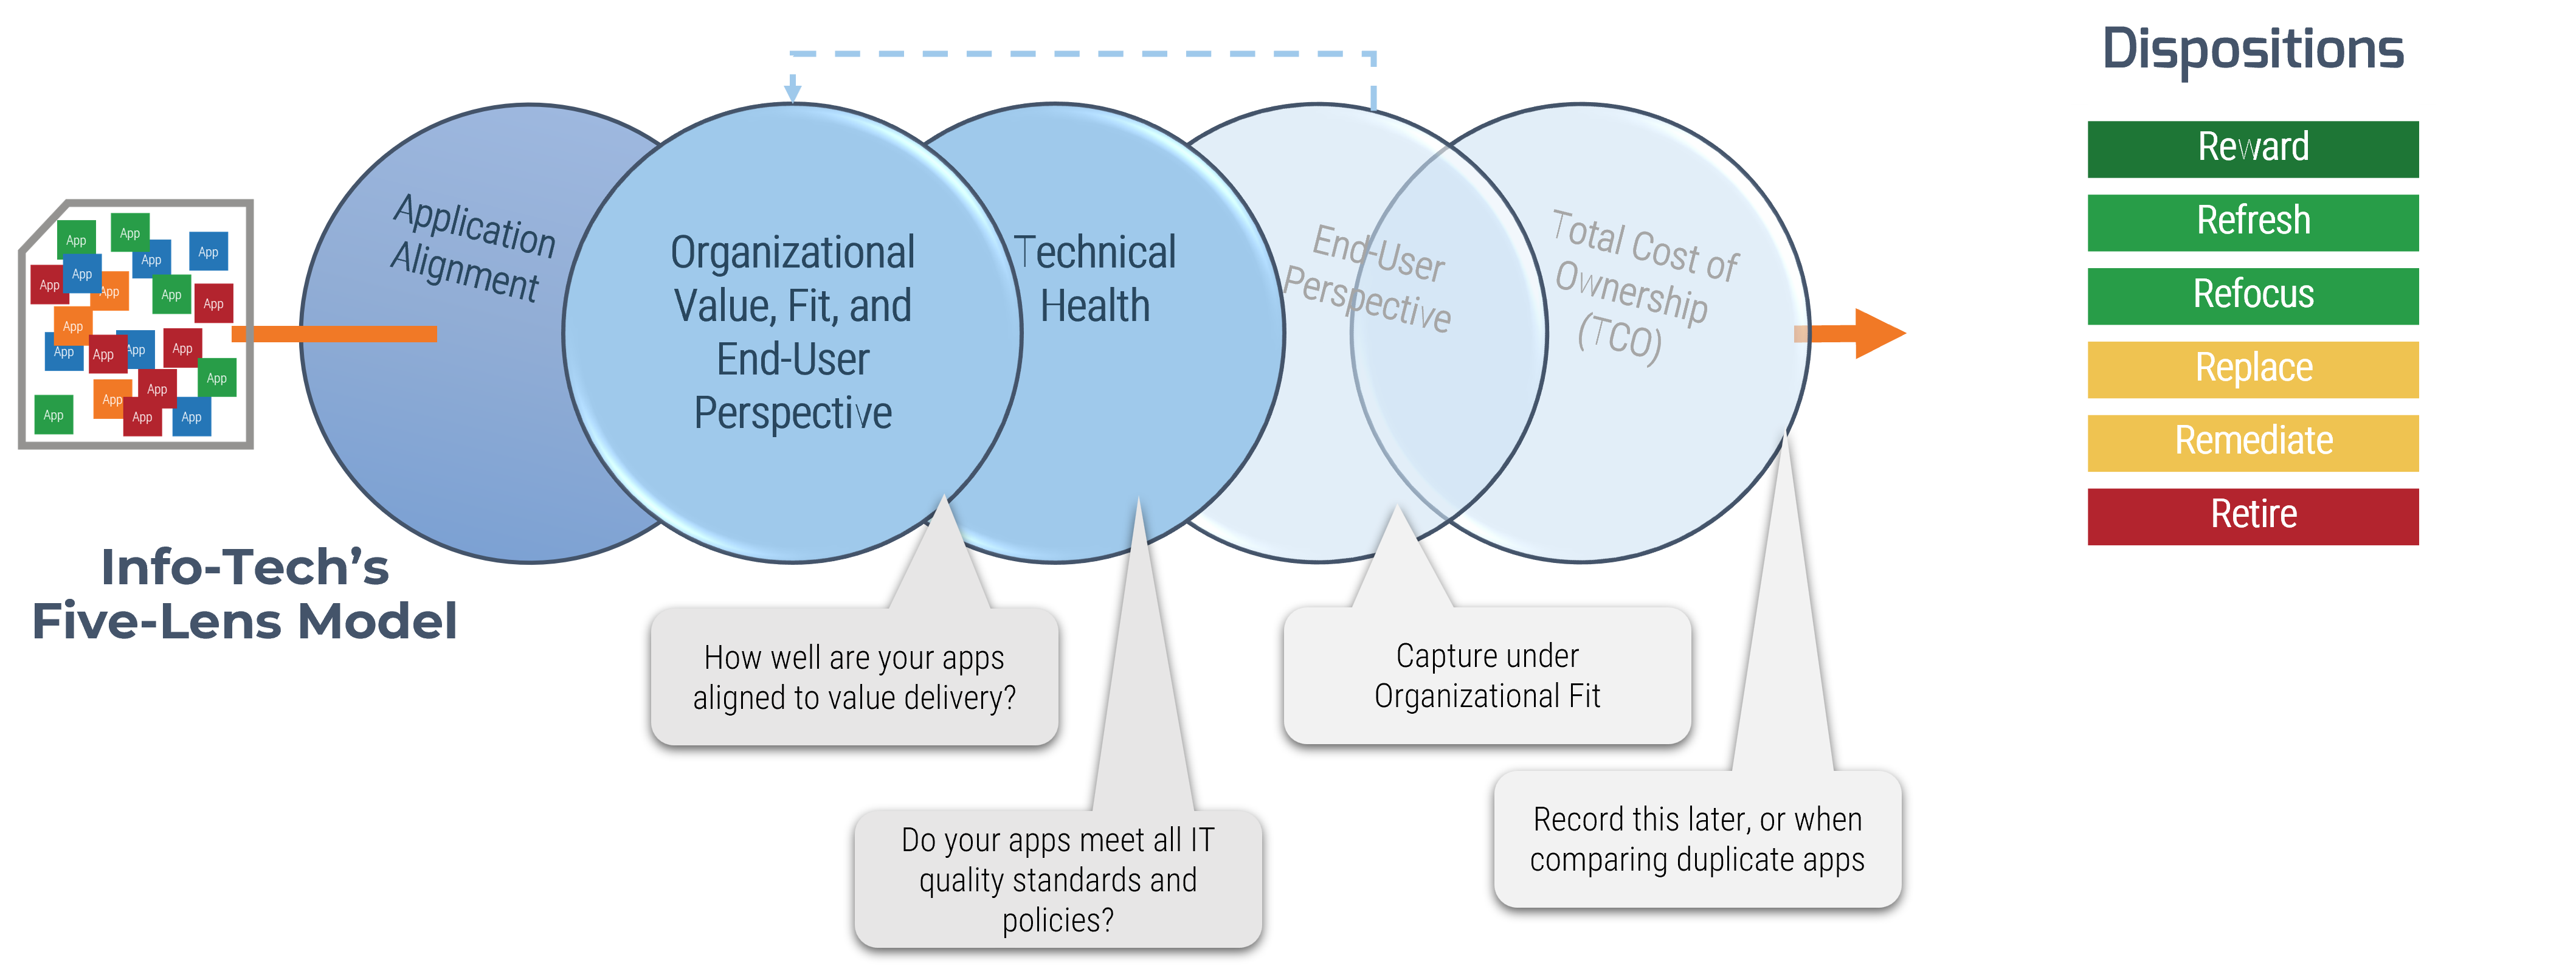
In the Rationalize Your Application Portfolio Tool, open the “Other Lens Criteria” for examples using the Value and Health lenses.
Assess your current application portfolio with Info-Tech’s APM Diagnostic Tool
Getting Started
One of the primary purposes of application portfolio management is to capture what we know and need to know on paper so that we can share a common vision and understanding of our portfolio. This enables better discussions and decisions with your application owners and stakeholders.
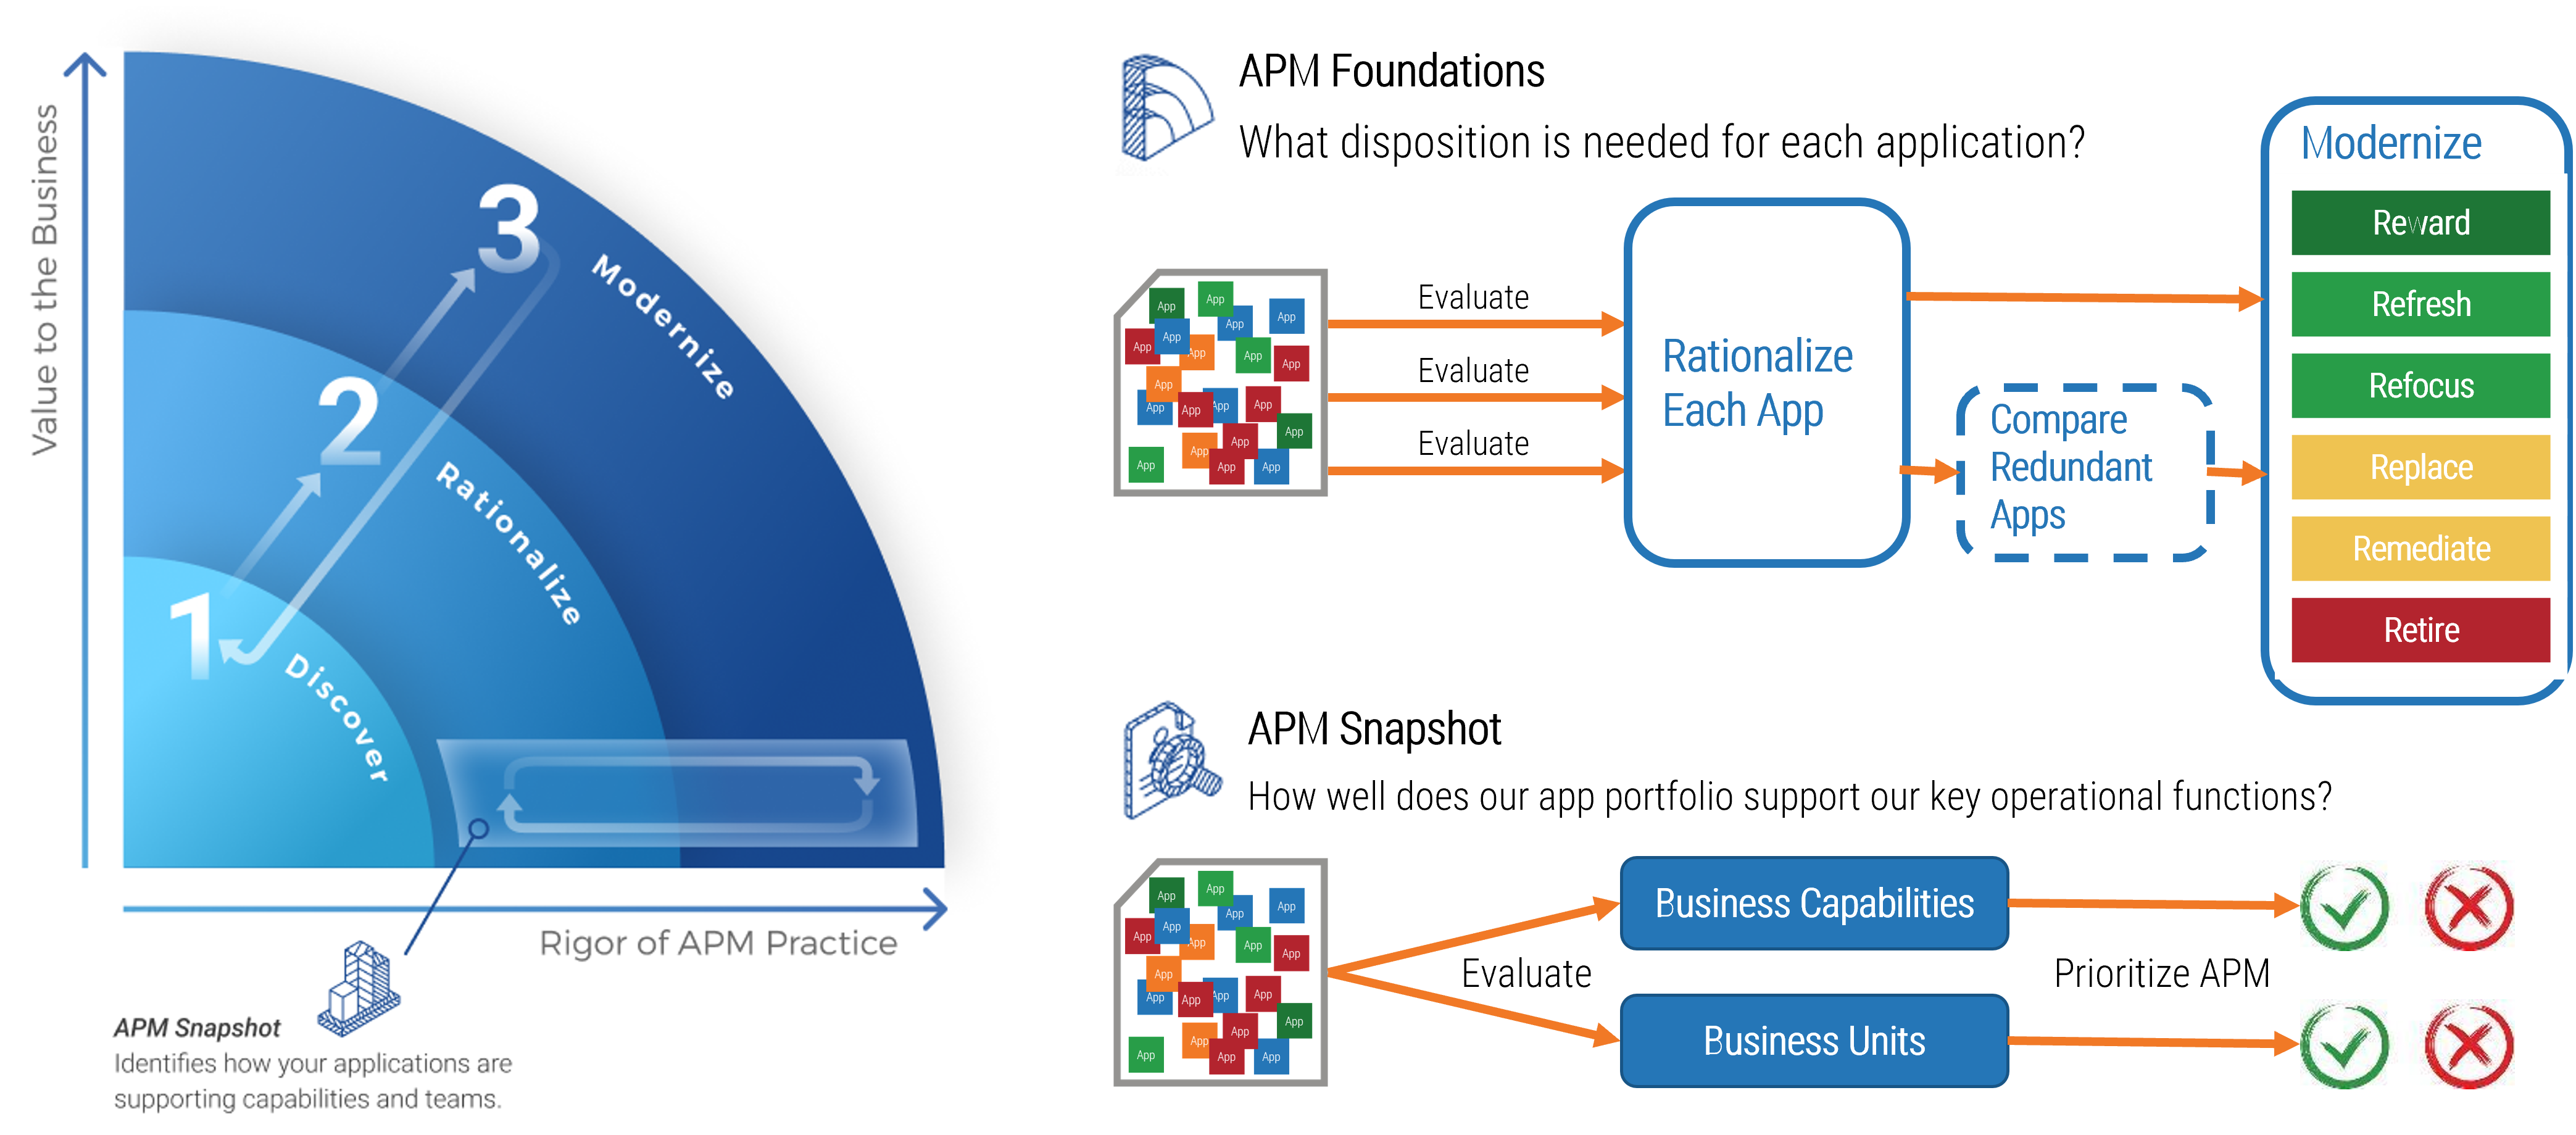
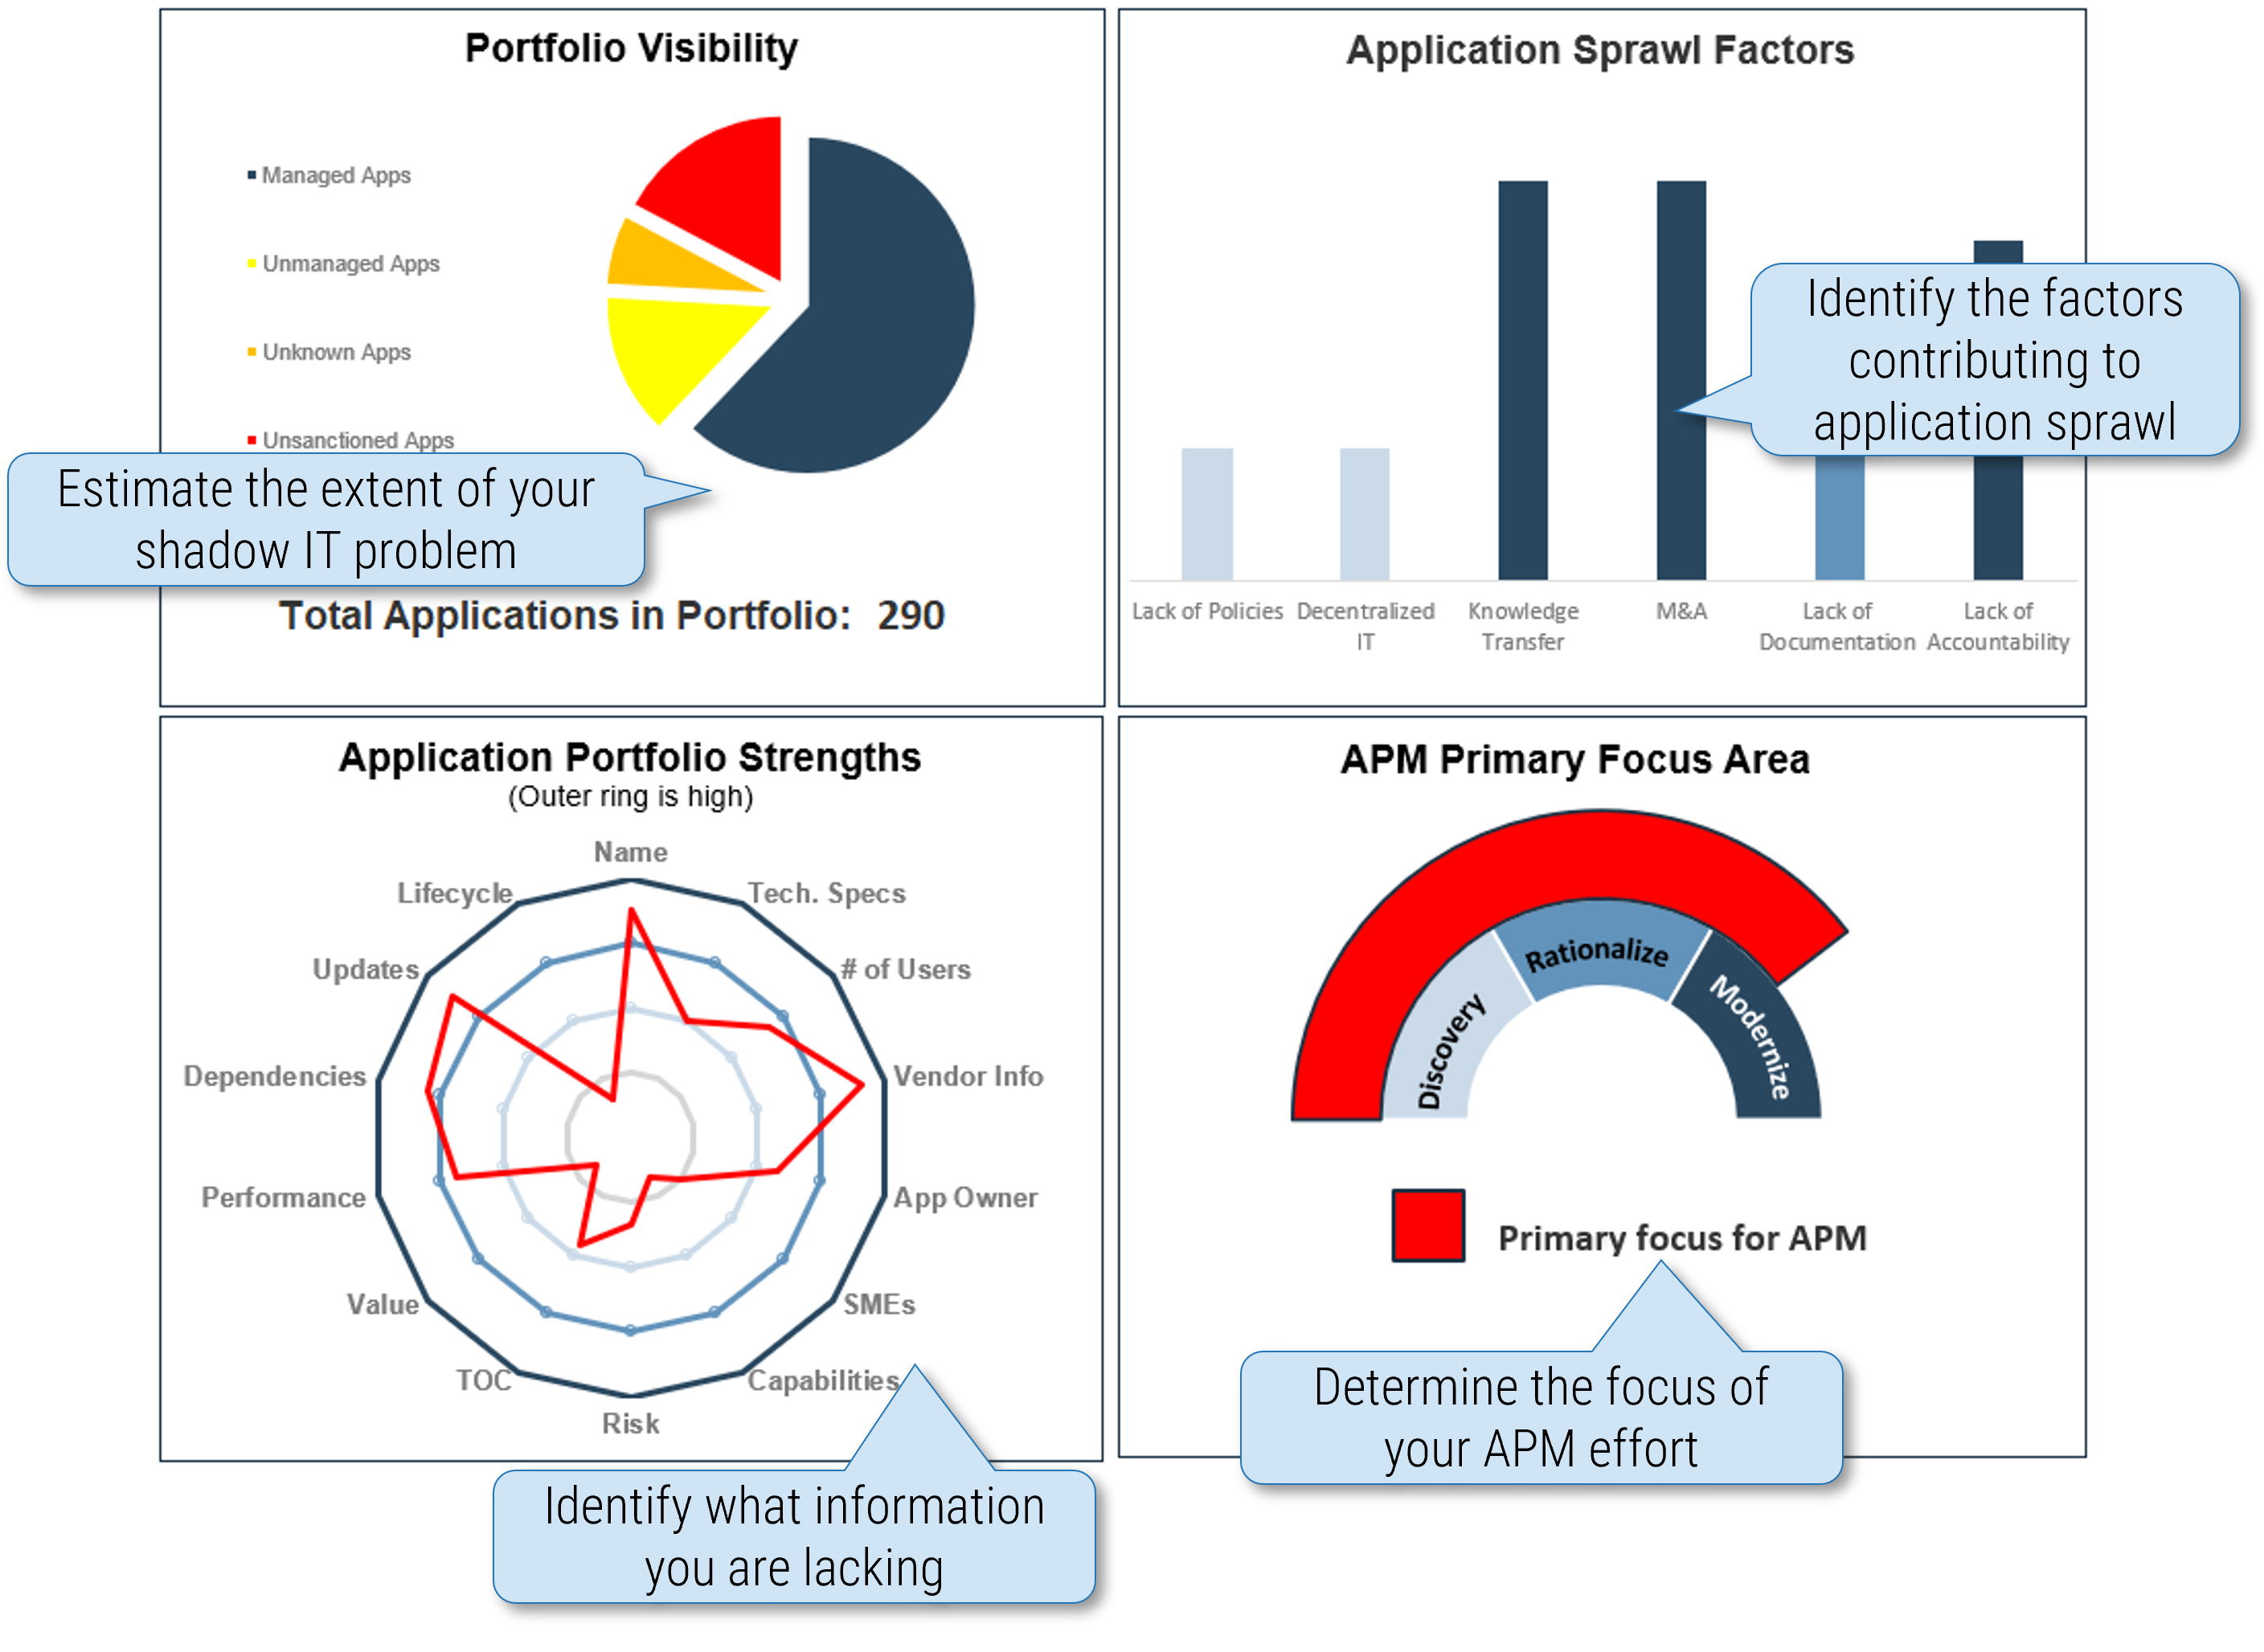
Interpreting your APM Foundations chart
Interpreting your APM Foundations results
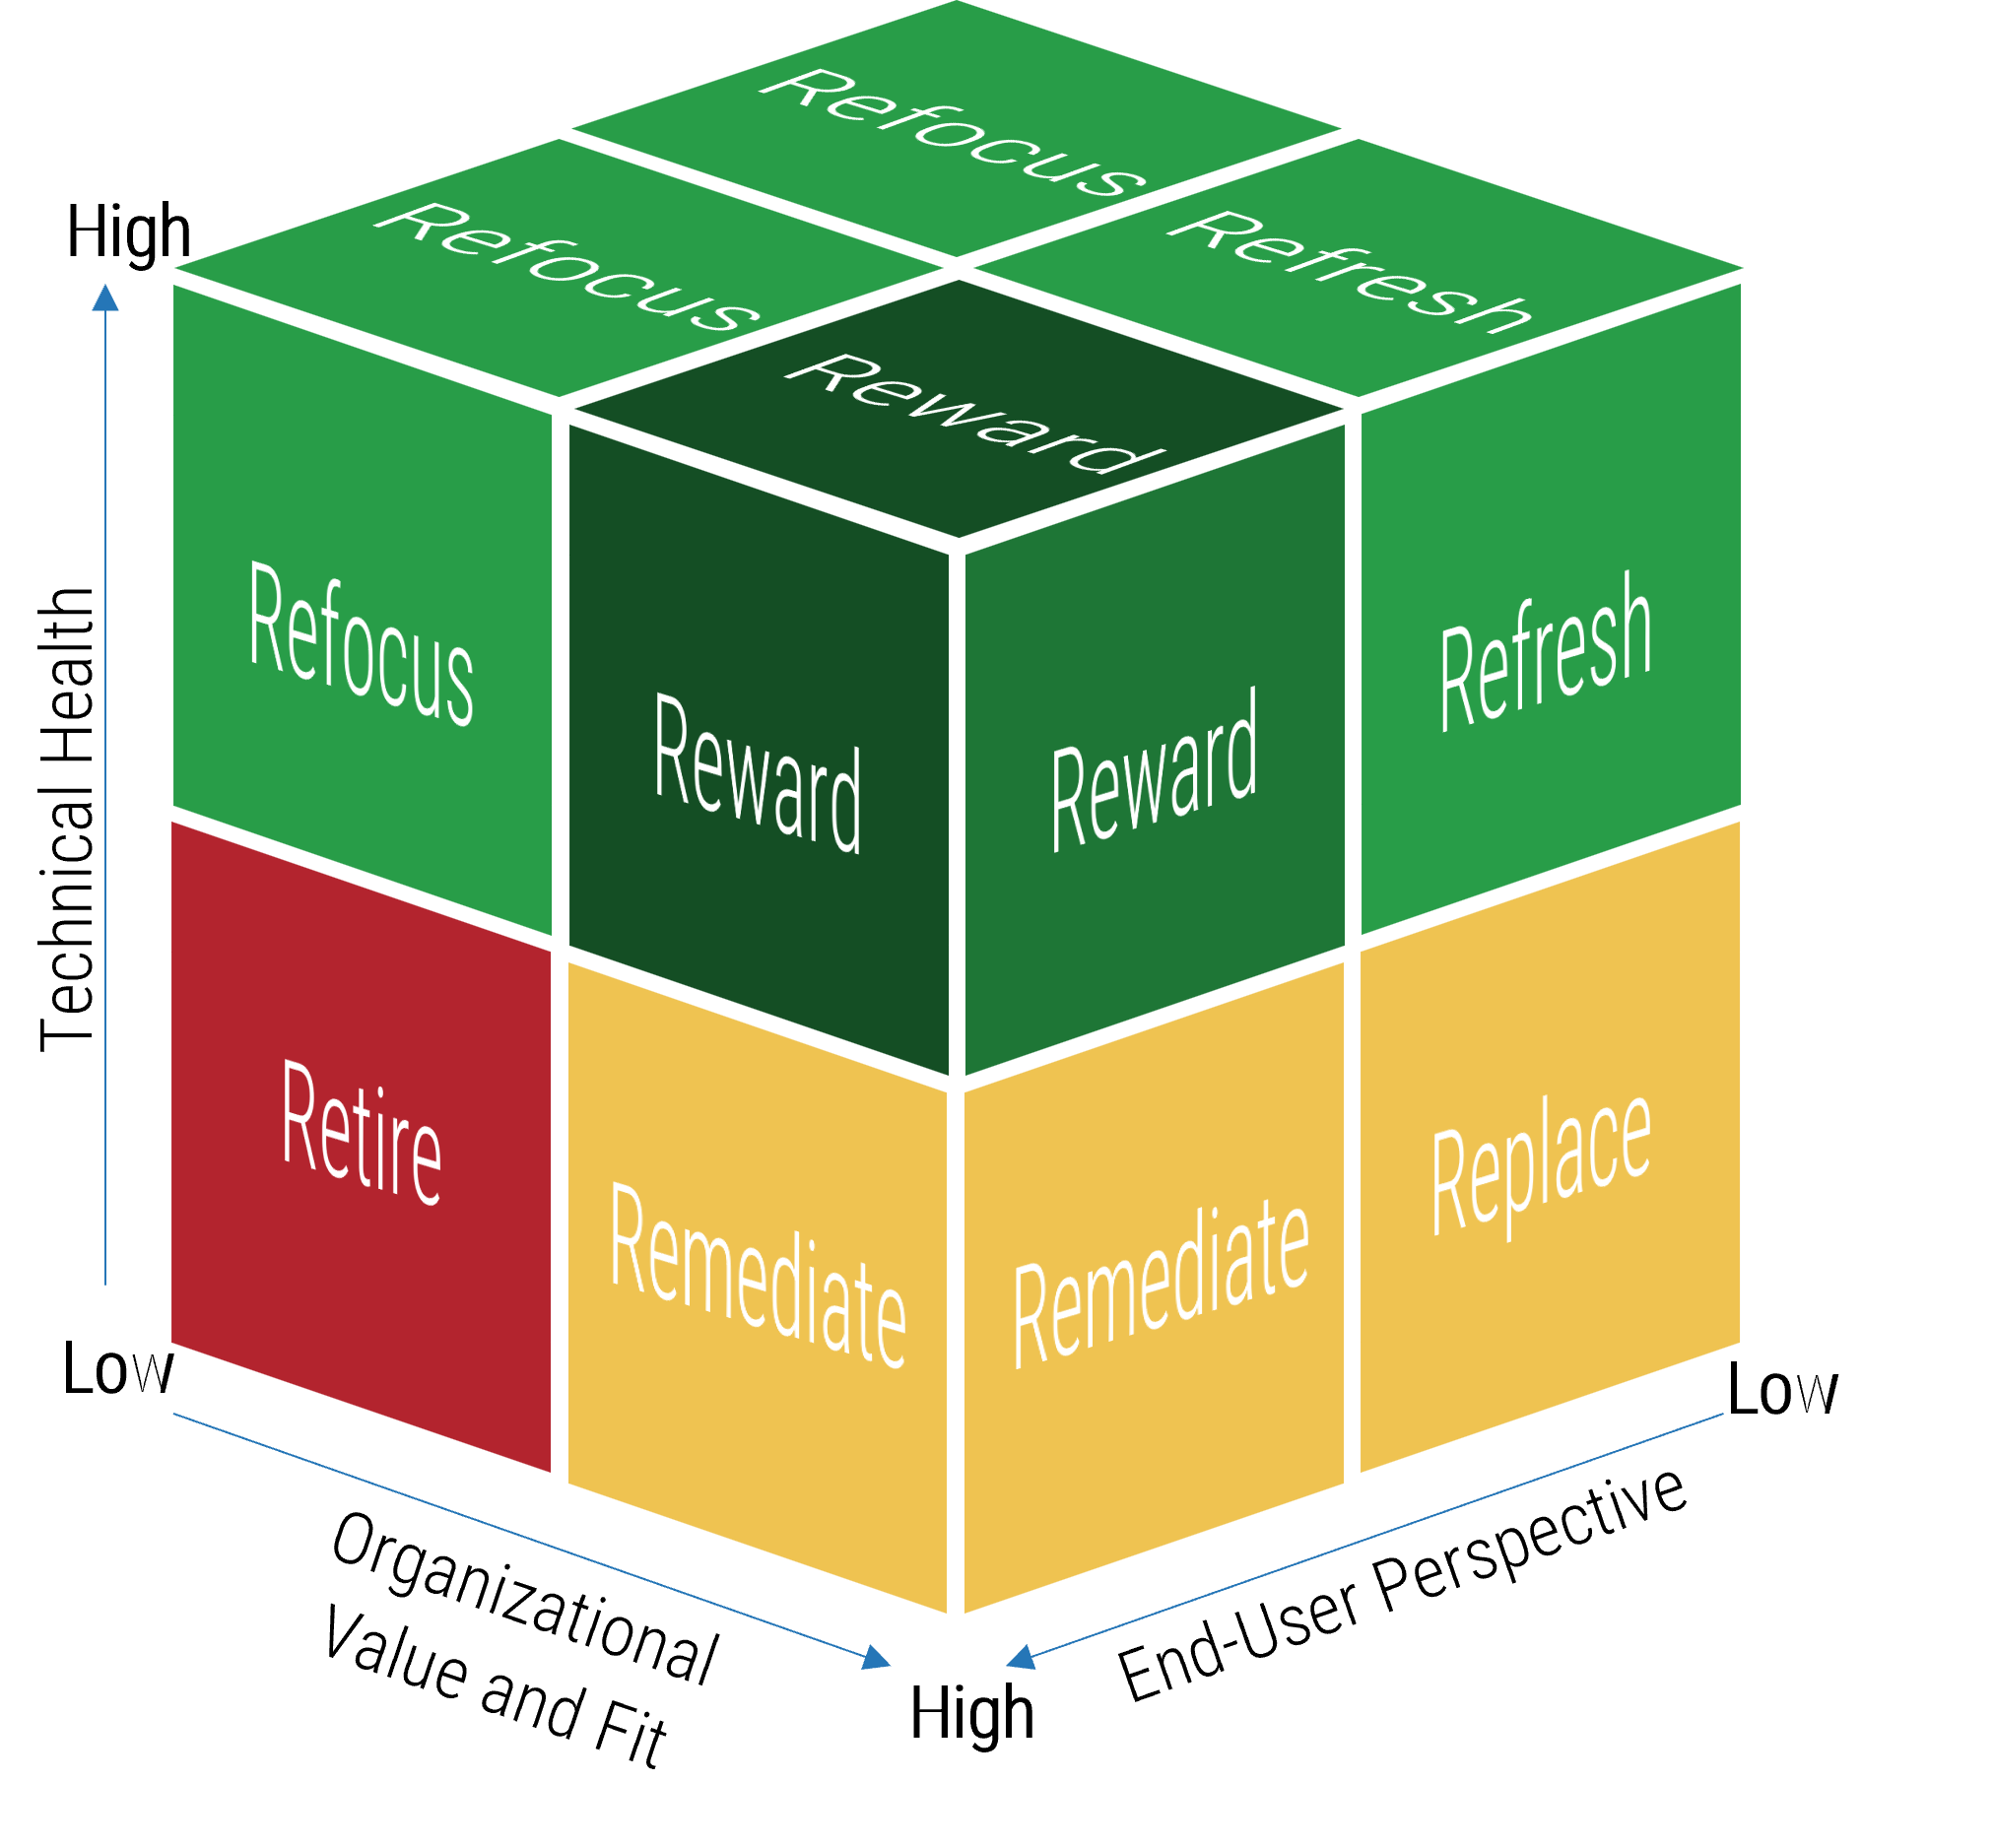
Apply Info-Tech’s 6 R’s Rationalization Disposition Model
Disposition | Description |
|---|---|
Reward | Prioritize new features or enhancement requests and openly welcome the expansion of these applications as new requests are presented. |
Refresh | Address poor end-user satisfaction with a prioritized project. Consult with users to determine if UX issues require improvement to address satisfaction. |
Refocus | Determine the root cause of the low value. Refocus, retrain, or refresh the UX to improve value. If no value is found, aim to "keep the lights on" until the app can be decommissioned. |
Replace | Replace or rebuild the application as technical and user issues are putting important business capabilities at risk. Decommission the application alongside the replacement. |
Remediate | Address poor technical health or risk with a prioritized project. Further consult with development and technical teams to determine if migration or refactoring is suited to address the technical issue. |
Retire | Cancel any requested features and enhancements. Schedule the proper decommission and transfer end users to a new or alternative system if necessary. |
TCO, compared relatively to organizational value and fit, helps determine the practicality of a disposition and the urgency of any call to action. Application alignment is factored in when assessing redundancies and has a separate set of dispositions.
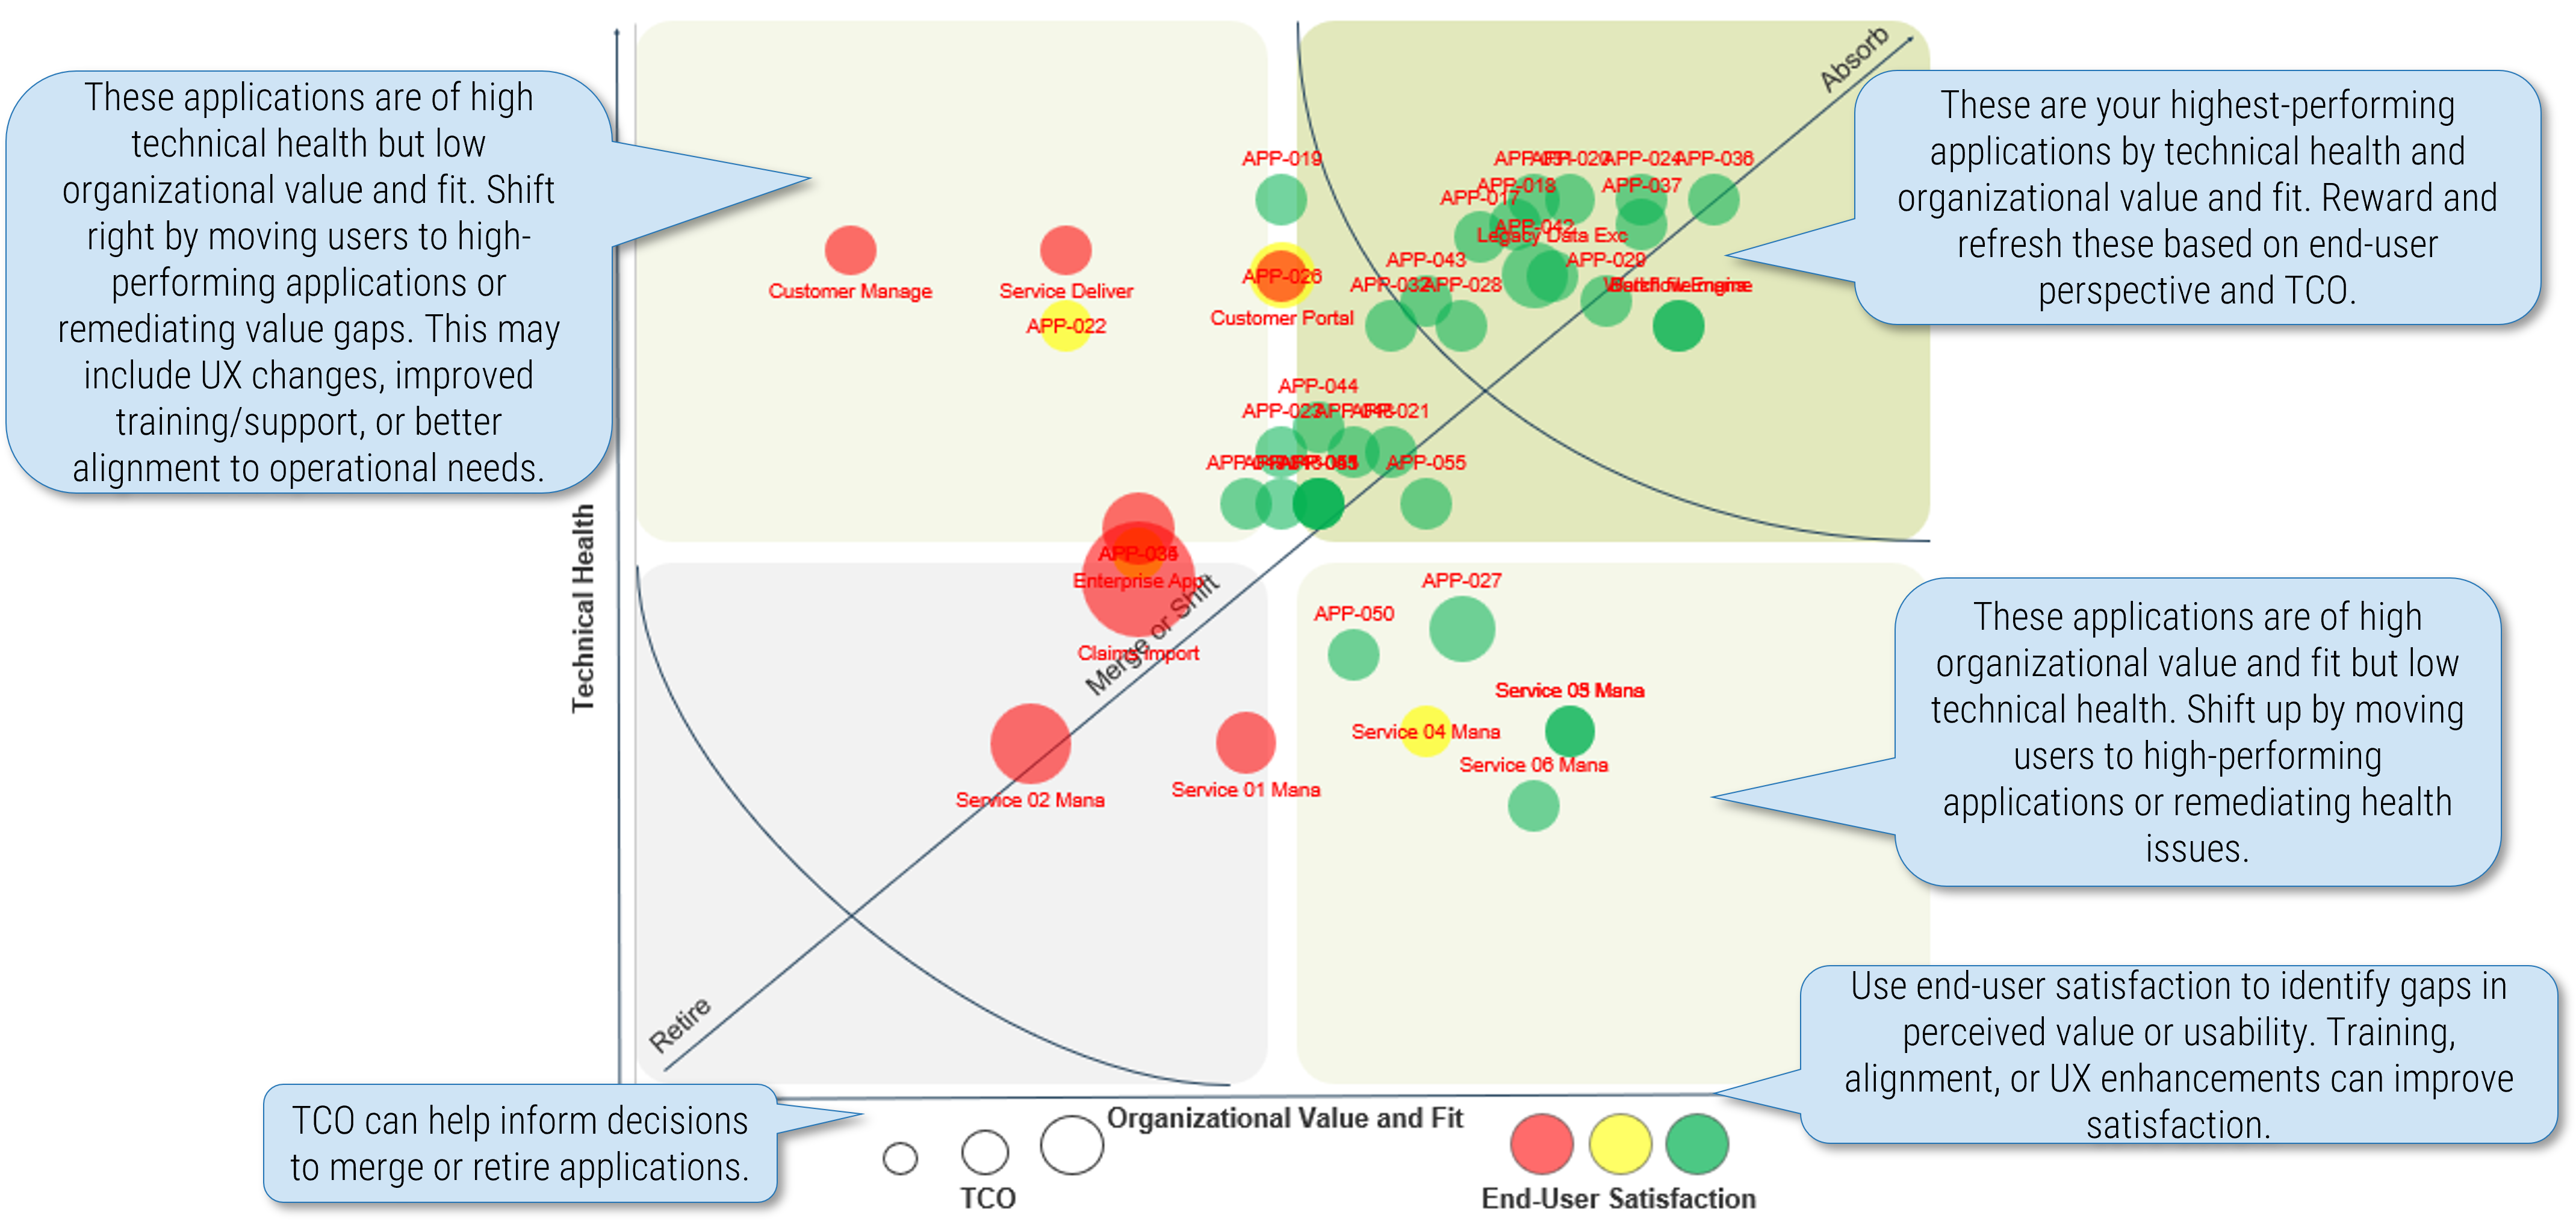
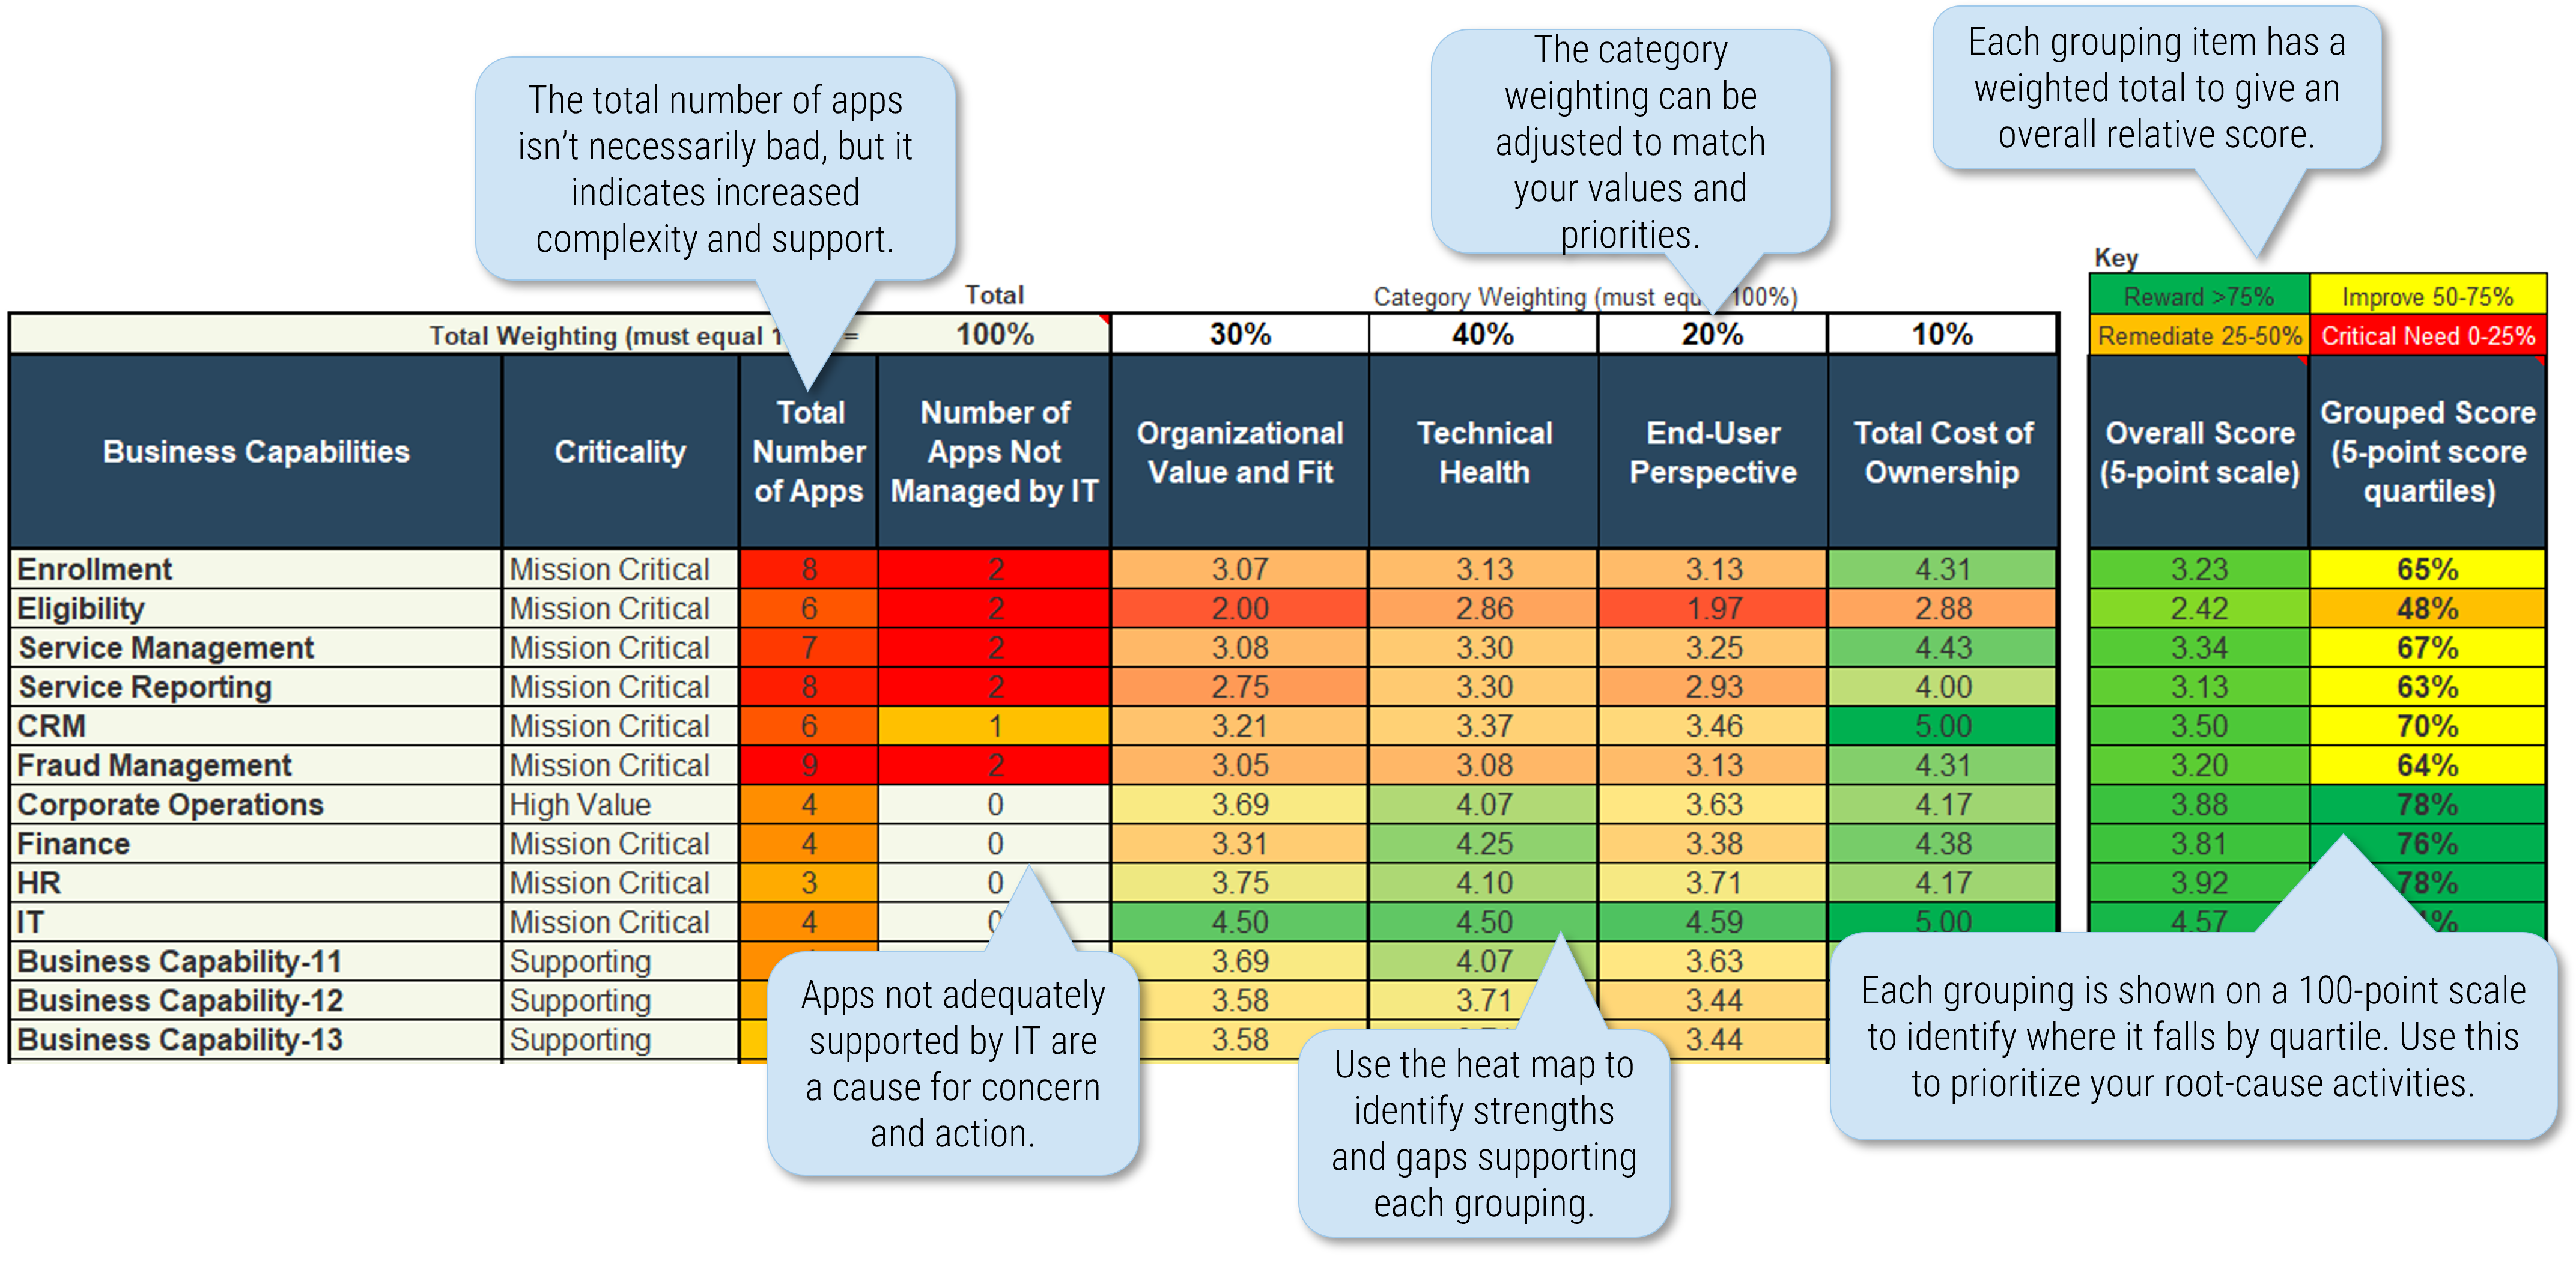
Interpreting your APM Snapshot results
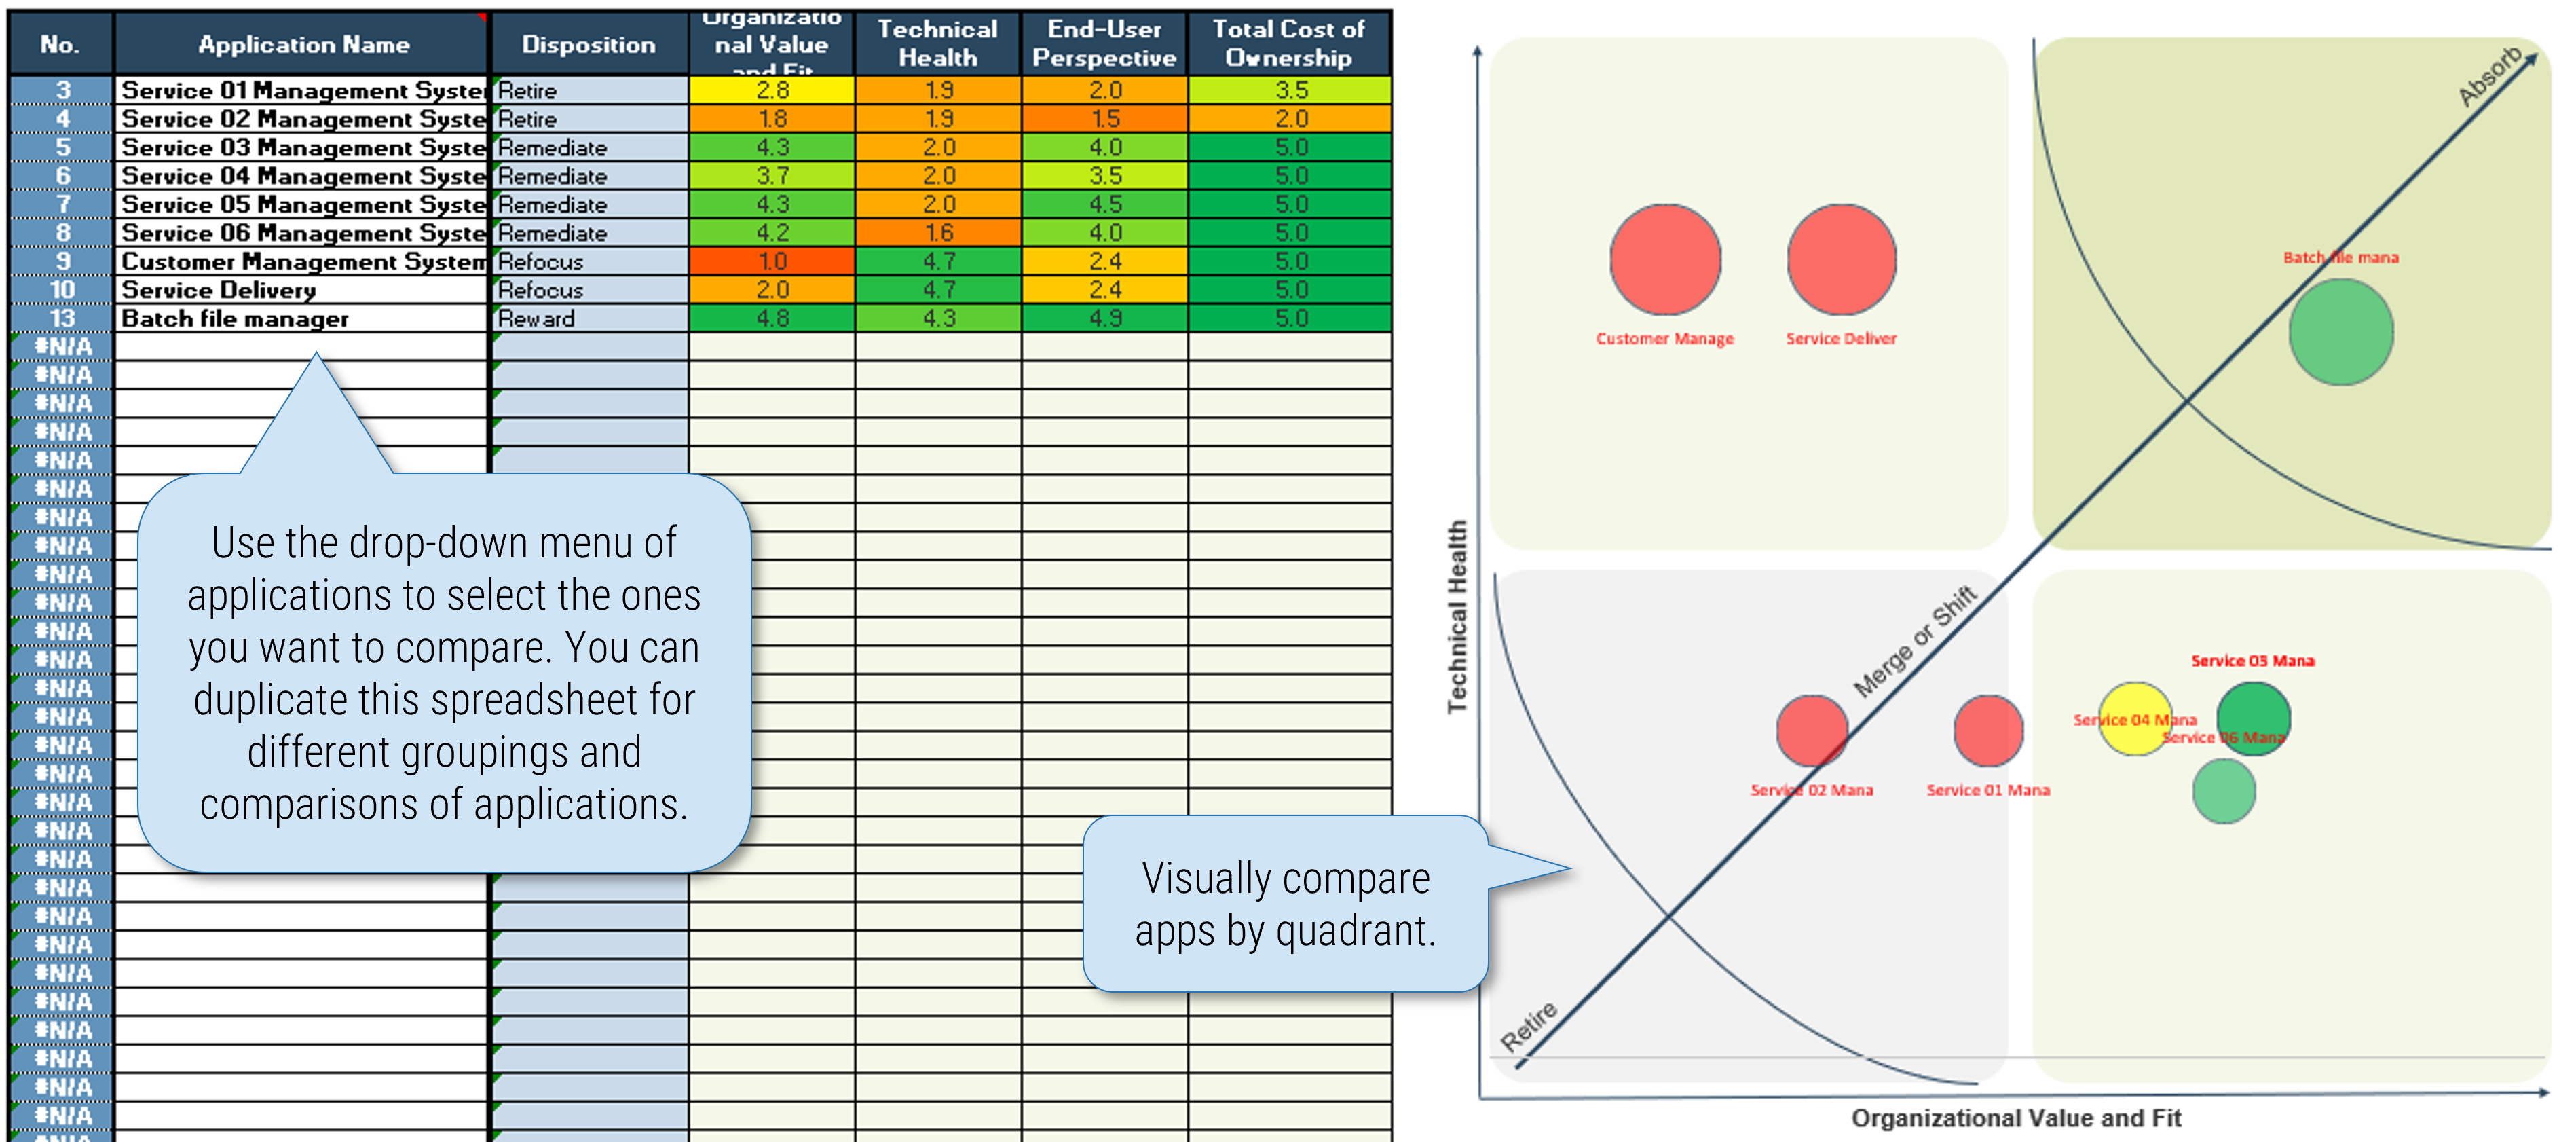
Compare application groups
Group comparison can be used for more than just redundant/overlapping applications.
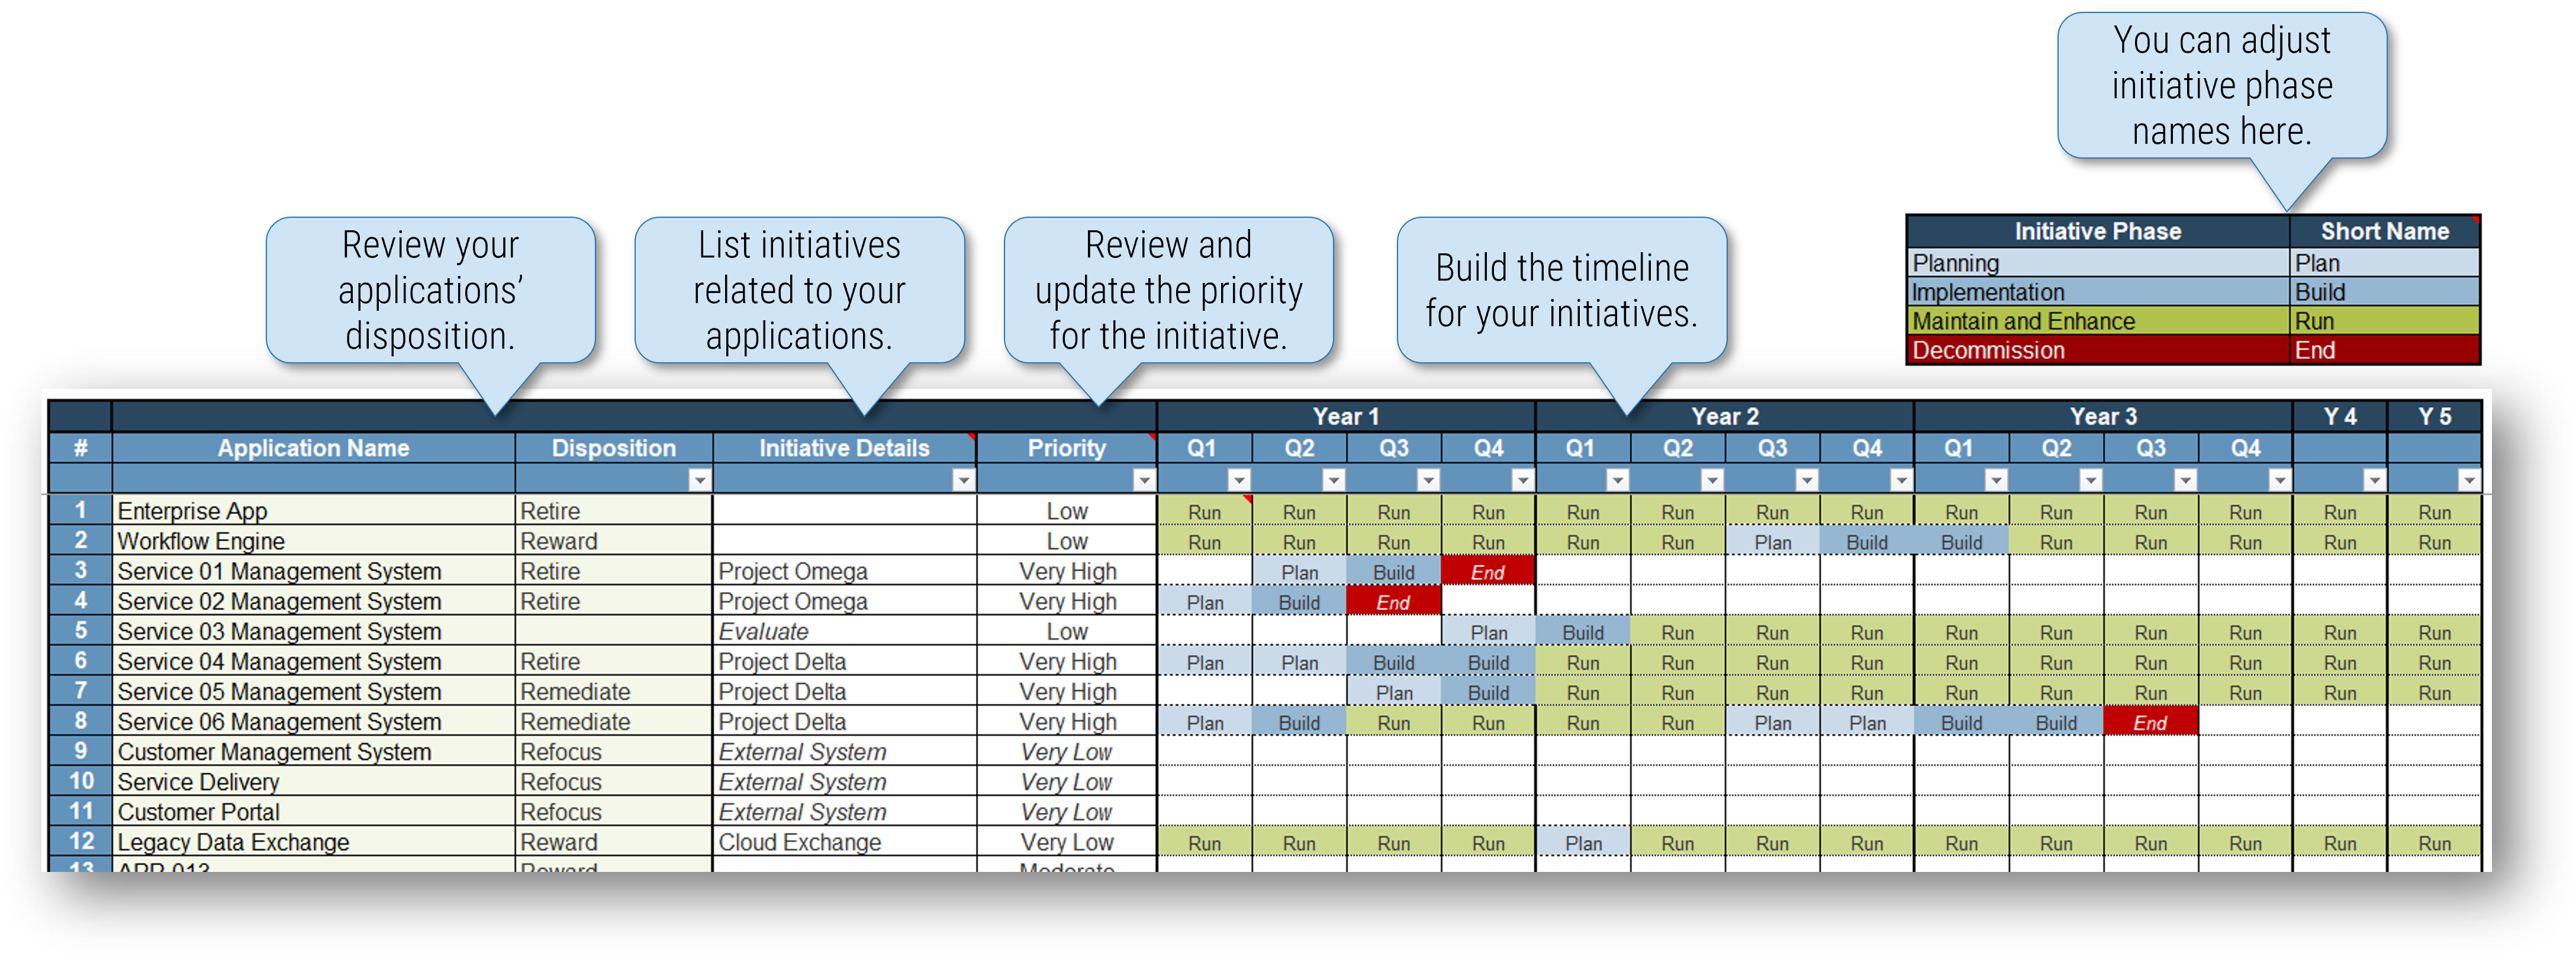
Populate roadmap example
About Info-Tech
Info-Tech Research Group is the world’s fastest-growing information technology research and advisory company, proudly serving over 30,000 IT professionals.
We produce unbiased and highly relevant research to help CIOs and IT leaders make strategic, timely, and well-informed decisions. We partner closely with IT teams to provide everything they need, from actionable tools to analyst guidance, ensuring they deliver measurable results for their organizations.
What Is a Blueprint?
A blueprint is designed to be a roadmap, containing a methodology and the tools and templates you need to solve your IT problems.
Each blueprint can be accompanied by a Guided Implementation that provides you access to our world-class analysts to help you get through the project.
Need Extra Help?
Speak With An Analyst
Get the help you need in this 4-phase advisory process. You'll receive multiple touchpoints with our researchers, all included in your membership.
Guided Implementation 1: Lay your foundations
- Call 1: Establish goals and foundations for your APM practice.
Guided Implementation 2: Improve your inventory
- Call 1: Initiate inventory and determine data requirements.
Guided Implementation 3: Rationalize your applications
- Call 1: Initiate rationalization with group of applications.
- Call 2: Review result of first iteration and perform retrospective.
Guided Implementation 4: Populate your roadmap
- Call 1: Initiate your roadmap and determine your ongoing APM practice.
 Applications Priorities 2025
 Rationalize Your Application Portfolio
 Extend Agile Practices Beyond IT
 Integrate Portfolios to Create Exceptional Customer Value
 Automate Your Software Delivery Lifecycle
 Build Your BizDevOps Playbook
 Modernize Your Applications
 Embrace Business-Managed Applications
 Build Your Applications Practice Strategy
 Review Your Application Strategy
 Assess the Value Drivers Within Your Solutions
 2020 Applications Priorities Report
 Applications Priorities 2022
 Make the Case for Product Delivery
 Satisfy Digital End Users With Low- and No-Code
 Select a Sourcing Partner for Your Development Team
 Applications Priorities 2023
 Make the Case for Enterprise Business Analysis
 Decide if You Are Ready for SAFe
 Adopt Generative AI in Solution Delivery
 Applications Priorities 2024
 Build Your Exponential IT Product Practice
 Insights Into Software Selection 2025
 Stay Relevant in the Era of AI-Powered Search
 Transform IT, Transform Everything
 Building Info-Tech’s Chatbot
 Assessing the AI Ecosystem
 Building the Road to Governing Digital Intelligence
 Bring AI Out of the Shadows
 The AI Vendor Landscape in IT
 An Operational Framework for Rolling Out AI
 Applications Priorities 2026
 Develop a Plan to Overcome Your Microsoft Power Apps Challenges