Demonstrate IT Value Through ITFM Reporting
Show IT’s return on investment through data-driven reporting.
CIOs are expected to prove IT’s value in business terms. But when IT financial management (ITFM) reporting focuses solely on cost, IT is viewed as an operational expense rather than a value creator. Demonstrating IT value requires a business-aligned reporting foundation that links costs, benefits, and outcomes. This blueprint equips organizations of any size or financial data maturity level with a practical roadmap to build that foundation, deliver executive-ready ITFM reporting, and move from cost transparency to measurable value.
Most organizations lack a repeatable way to connect IT spend to services, projects, and business value. That means budget discussions fixate on expense control instead of ROI, and IT’s impact remains unclear to the C-suite. Don’t just track IT spend; adopt a data-based methodology to help your CFO, CEO, and other CxOs understand the services delivered, outcomes enabled, and returns generated.
1. Unify the story.
CFOs focus on efficiency, CxOs on delivery and benefits, and CEOs on enterprise impact. Without a unified reporting model, IT value is explained in pieces and trust erodes. A single framework aligns definitions, data sources, and narratives across the C-suite.
2. Translate spend into value.
Most spend data is organized for accounting, not decision-making. Standardized taxonomy and value metrics translate costs into services, projects, outcomes, and value levers. Feedback loops turn expected benefits into measured signals that improve credibility over time.
3. Report for executive decisions.
Executive reporting must be role specific and repeatable. CFO views should explain variances and benchmark efficiency, CxO views should track benefits and delivery performance, and CEO views should show value contribution. Consistent reporting enables trade-offs across run, grow, and innovate investments.
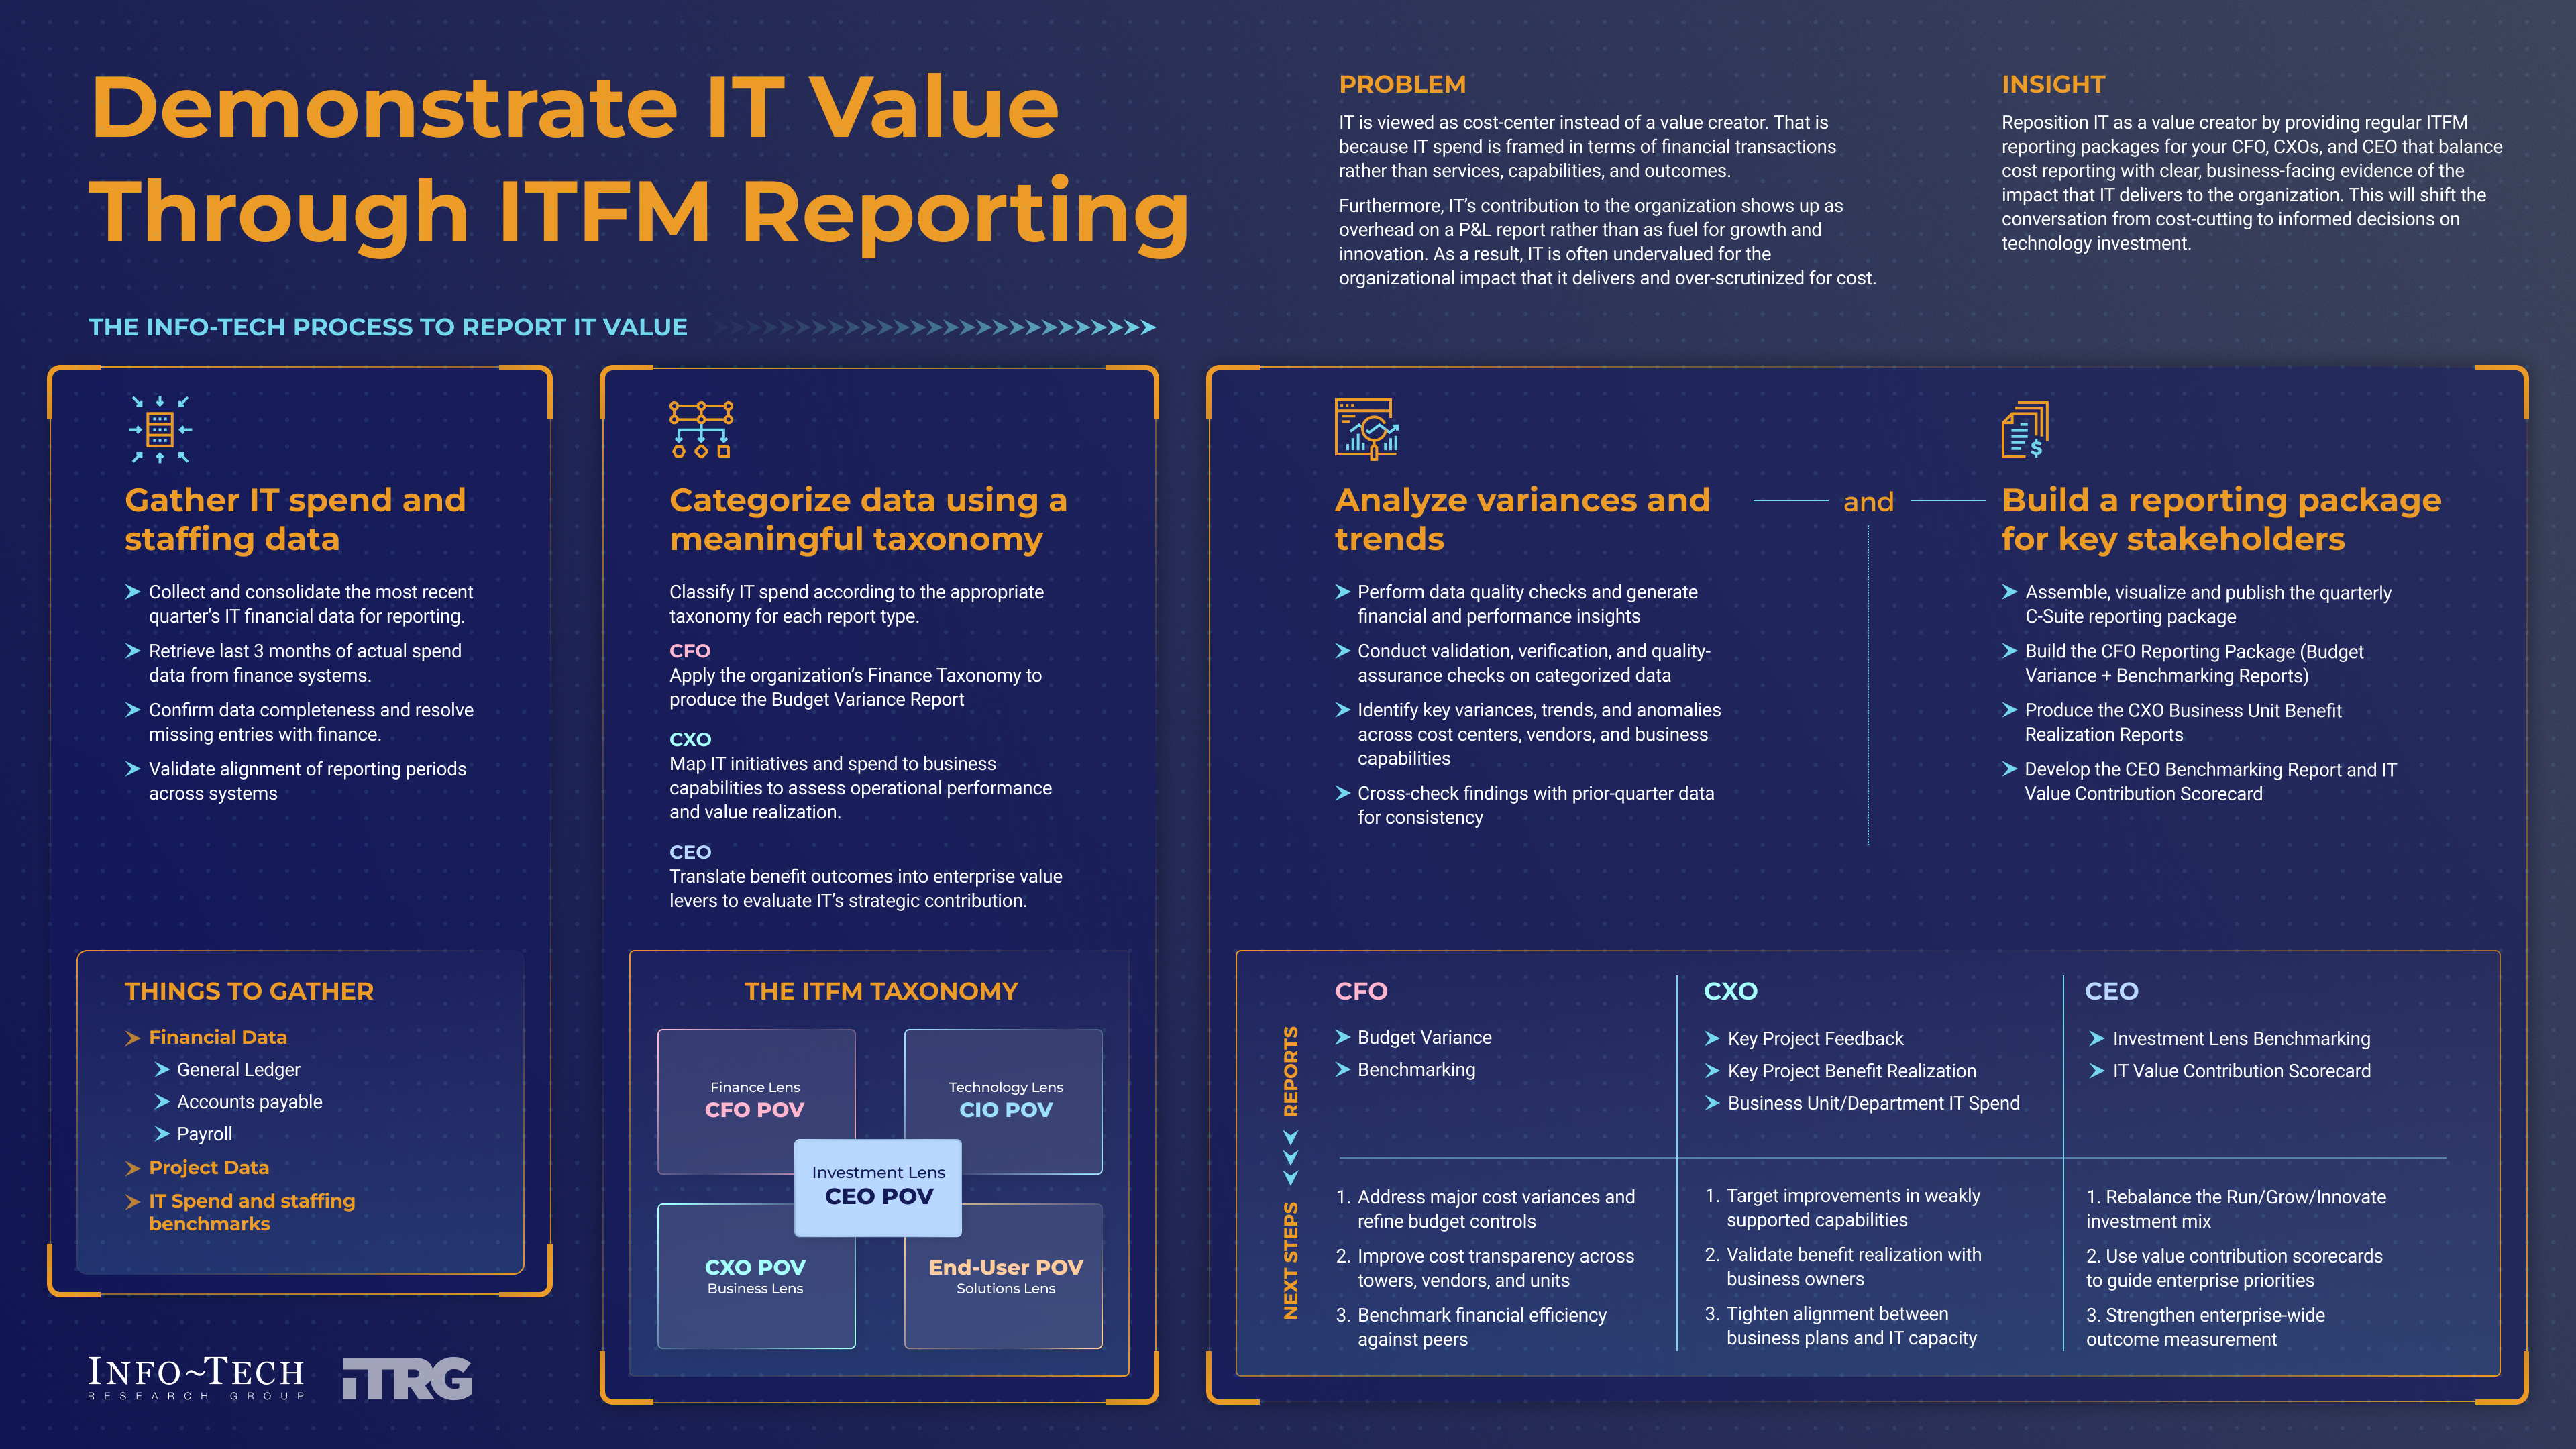
Use this step-by-step blueprint to translate IT spend into business meaning.
This framework equips you with the methodology and supporting tools to build confidence in technology investment governance through clearer, measurable reporting. Use Info-Tech's clear, three-phase approach to:
- Gather IT spend and staffing data. Define the reporting framework and service levels, then collect and consolidate IT spend and staffing data.
- Categorize data using a meaningful taxonomy. Extract and map spend data to ITFM taxonomy.
- Analyze, interpret, and build reporting packages. Analyze variances and trends, then build a reporting package for key stakeholders (CFO, CxO, and CEO).
Demonstrate IT Value Through ITFM Reporting
Show IT’s return on investment through data-driven reporting.
Demonstrate IT Value Through ITFM Reporting
Show IT’s return on investment through data-driven reporting.
EXECUTIVE BRIEF
Analyst perspective
Costs tell half the story. Value tells the rest.
CIOs are under growing pressure to justify technology spend and prove that IT contributes to enterprise outcomes. But in most organizations, IT financial reporting was built for cost control, not value demonstration. Cost centers and vendors track spend, but business leaders want to understand services delivered, outcomes enabled, and returns generated.
When IT cannot translate financial data into business meaning, executive conversations default to budgets, cuts, and anecdotal project “wins.” The result is predictable: IT is labeled a cost center, benefits realization is inconsistent, and the organization struggles to make informed trade-offs across run, grow, and transform investments.
Demonstrating IT value isn’t storytelling. It requires a reporting foundation that links costs, benefits, and outcomes. This blueprint provides a practical approach to build that foundation and deliver executive-ready ITFM reporting that moves from cost transparency to measurable value.

Steven Nguyen
Research Analyst
Info-Tech Research Group
Executive summary
Your Challenge
As a CIO or IT leader, you are under pressure to justify technology investments and demonstrate IT’s contribution to business performance. Despite rising digital spend, IT is still viewed as a cost center because reporting focuses on expenses rather than outcomes. Without a repeatable way to connect IT spend to services, projects, and business value, IT’s impact remains unclear to the C-suite.
You need a business-aligned reporting model that establishes cost of ownership with the enterprise to quantify ROI and position IT as a strategic partner.
Common Obstacles
Most organizations lack a repeatable way to connect IT spend to measurable outcomes.
- IT is viewed as a cost center. Budget discussions focus on expense control, not ROI or impact.
- Feedback on outcomes is limited. Project success is anecdotal and reactive with few baselines.
- The path to value is unclear. Services, products, and projects aren’t mapped to business value.
Conventional approaches don’t fix data meaning or outcome tracking, so value remains hard to prove.
Info-Tech’s Approach
This blueprint delivers a repeatable framework that connects IT spend to measurable value:
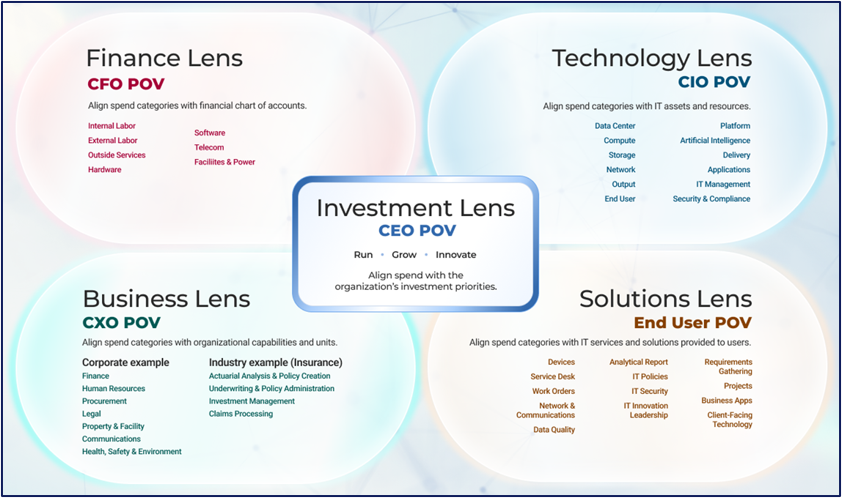
- Apply a standardized ITFM taxonomy, with lenses that speak to the unique needs of your stakeholders, to your technology spend.
- Develop KPIs that appeal to key stakeholders and translate IT efforts and costs into metrics that matter to the business.
- Produce executive-ready reporting for CFO, CxO, and CEO audiences using standard outputs.
Move Beyond Cost Transparency
ITFM reporting creates credibility when it links spend to outcomes in a consistent, executive-ready story. This blueprint helps CIOs build that foundation and demonstrate measurable value.
Your challenge
CIOs are expected to prove IT’s value in business terms, but when reporting stays cost focused, IT is treated as an operational expense rather than a value creator.
- Financial reporting lacks business meaning. Spend data is categorized by cost centers instead of services, capabilities, or outcomes, making it difficult to demonstrate value alignment.
- Feedback on project performance is anecdotal. Business leaders provide informal or inconsistent feedback on technology projects with limited quantitative evidence of benefits realized.
- No unified reporting framework exists. Each C-suite stakeholder requires different insights; CFOs need efficiency and variance reporting, CxOs need benefit realization, and CEOs need value contribution. However, IT lacks a consistent way to deliver these perspectives.
Without measurable links between IT spend and business outcomes, IT’s contribution remains unclear and budget conversations default to cost control.
85% of CIOs report growing pressure for technology to demonstrate tangible business impact.
64% of CIOs say their next-generation technology investments have yet to deliver anticipated returns. (Logicalis, 2025)
Without business-aligned ITFM reporting, IT value stays invisible
Where cost transparency falls short of value realization
Cost-Only Reporting
Most IT financial data is organized for accounting and budget control (cost centers, general ledger (GL) codes, vendors), not for explaining what the business is getting (services, products, capabilities). As a result, reporting answers “what did we spend?” but not “what outcomes did we enable?” and IT continues to be perceived as a cost center.
Anecdotal Benefits and Weak Feedback Loops
Benefits are often documented at intake but not measured after delivery. Without baselines, accountable owners, and a consistent measurement cadence, project outcomes become subjective and reactive. This limits IT’s ability to prove ROI, learn from delivery performance, and improve future investment decisions.
Fragmented Executive Views
CFO, CxO, and CEO stakeholders need different insights, but IT often produces disconnected reports with inconsistent definitions and numbers. When cost, benefits, and outcomes aren’t tied together in a single model, credibility erodes and executive conversations shift from informed trade-offs to budget cutting and escalation.
Benefits of Effective ITFM Value Reporting
- Prove Value
- Improve Financial Discipline
- Align Investments
Info-Tech’s approach
Use our framework to develop and deliver.

See next slide for full-size image.
The Info-Tech difference:
- Follow the money before forcing chargeback. We help you establish total cost of ownership with the business using practical allocation rules.
- Translate spend into business meaning. We apply a standardized taxonomy and value metrics to connect services and projects to outcomes and value levers.
- Deliver executive-ready reporting packages. We provide repeatable CFO, CxO, and CEO views that make IT value visible and defensible.
Insight summary
Unify the Story
CFOs focus on efficiency, CxOs on delivery and benefits, and CEOs on enterprise impact. Without a unified reporting model, IT value is explained in pieces and trust erodes. A single framework aligns definitions, data sources, and narratives across the C-suite.
Translate Spend Into Value
Most spend data is organized for accounting, not decision-making. Standardized taxonomy and value metrics translate costs into services, projects, outcomes, and value levers. Feedback loops turn expected benefits into measured signals that improve credibility over time.
Report for Executive Decisions
Executive reporting must be role specific and repeatable. CFO views should explain variances and benchmark efficiency, CxO views should track benefits and delivery performance, and CEO views should show value contribution. Consistent reporting enables trade-offs across run/grow/innovate investments.
Info-Tech Insight
Attempts to demonstrate IT value fail when organizations rush to dashboards without defining the outcomes that matter. Starting with clarity on value and audience creates reporting that resonates and elevates IT’s role.
Blueprint benefits
IT Benefits
- Build a repeatable ITFM reporting model that connects spend to services, projects, and outcomes.
- Establish cost of ownership with Finance and business stakeholders using practical allocation rule.
- Standardize metrics, definitions, and reporting cadence to reduce ad hoc analysis and rework.
- Improve forecasting and variance explanation by benchmarking and trend analysis.
- Operationalize benefits tracking with simple feedback loops to validate realized value.
- Strengthen IT credibility by producing executive-ready reporting packages.
Business Benefits
- Increase transparency into where technology dollars go and what they enable.
- Improve investment decisions with a consistent view of efficiency, outcomes, and value contribution.
- Reduce budget friction by shifting conversations from cost cutting to value and trade-offs.
- Improve accountability for benefits realization across projects and business owners.
- Surface and reduce duplicated spend including shadow IT by improving visibility into total cost.
- Build confidence in technology investment governance through clearer, measurable reporting.
Blueprint deliverables
Key deliverable:
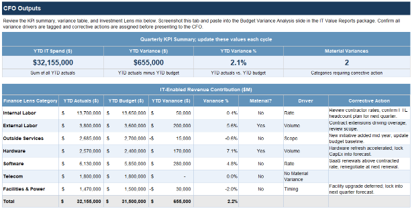
IT Value Reports
Use this PowerPoint to document and communicate your IT value across different reporting views.
The other key deliverables of this blueprint: three reporting workbooks that are tailored to your CFO, CxO, and CEO audiences.
CIO (You)
Use IT Spend & Staffing Benchmarking to build the foundation for value reporting
While not a requirement, Info-Tech’s IT Spend & Staffing (ITSS) Benchmarking service can help set spend baselines that bring context to value reporting.
This blueprint gives you the tools to map your spend to Info-Tech’s ITFM taxonomy and produce quarterly value reports based upon your data. Info-Tech’s ITSS service can help fast-track these activities and bring context to your data as you kick-off your reporting optimization.
Through this service, an Info-Tech ITFM expert will tag your data using our proven taxonomy and will benchmark your spend against your peers’.
The service provides:
- Spend and staffing mapping for transparency into business consumption of IT.
- Full industry benchmarking comparing your spending to that of your peers.
- Results in a fraction of time with minimal effort compared to going it alone.
- Expert review of results and ongoing ITSS discussions with Info-Tech’s ITFM experts.
Visit our IT Spend & Staffing Benchmarking overview page
Leverage Info-Tech’s ITFM expertise and benchmarking data quarterly
Organizations can work through this blueprint using traditional delivery methods or have Info-Tech do the work through quarterly Technical Counselor touchpoints.
Traditional(DIY, Guided Implementation, workshop) |
ITFM Technical Counselor Guided |
|
What it is |
Use the blueprint through Info-Tech’s standard delivery methods: DIY toolkit, Guided Implementation, or workshop. | Accelerated service path where an Info-Tech Technical Counselor (TC) helps you produce quarterly value reports. |
What Info-Tech does |
Your team leads the work of mapping spend, using the tools, and building the reports, with the level of Info-Tech support varying by delivery mode. | Your TC helps tag your spend data to Info-Tech’s ITFM taxonomy, benchmarks your spend against your peers’, and prepares quarterly value reports with your inputs. |
What is included |
|
|
Both paths use the same overall framework. The difference is how much support you get, how quickly you move, and whether quarterly benchmarking is included. Contact your Info-Tech account representative to learn more about the ITFM Technical Counselor guided experience.
Overview (Technical Counselor guided service and workshop)
Contact your account representative for more information.
workshops@infotech.com 1-888-670-8889
Step 1 |
Step 2 |
Step 3 |
Step 4 |
|
Data Gathering |
Taxonomy Classification |
Variance & Trend Analysis |
Executive Reporting |
|
Activities |
|
|
|
|
Participants |
|
|
|
|
If guided by an ITFM TC, repeat Steps 2-4 quarterly to deliver executive reporting and track progress.
Guided Implementation
A Guided Implementation (GI) is a series of calls with an Info-Tech analyst to help implement our best practices in your organization.
A typical GI is six to eight calls over the course of one to three months.
What does a typical GI on this topic look like?
Introduction |
Map Spend |
Prepare Value Inputs |
Prepare to Report |
| Call #1:Scope requirements, objectives, and your specific challenges. | Call #2: Customize ITFM taxonomy.
Call #3: Map spend to taxonomy. |
Call #4: Create a budget variance visual.
Call #5: Determine project benefits data. Call #6: Determine IT’s value contributions. |
Call #7: Customize Info-Tech’s IT value reports templates with your inputs.
Call #8: Conduct final review and prepare to present. |
Info-Tech offers various levels of support to best suit your needs
DIY Toolkit |
Guided Implementation |
Workshop |
Consulting |
| “Our team has already made this critical project a priority, and we have the time and capability, but some guidance along the way would be helpful.” | “Our team knows that we need to fix a process, but we need assistance to determine where to focus. Some check-ins along the way would help keep us on program.” | “We need to hit the ground running and get this project kicked off immediately. Our team has the ability to take this over once we get a framework and strategy in place.” | “Our team does not have the time or the knowledge to take this project on. We need assistance through the entirety of this project.” |
Diagnostics and consistent frameworks are used throughout all four options. |
|||
Demonstrate IT Value Through ITFM Reporting
Phase 1: Gather IT Spend and Staffing Data
| ↻ Phase 2-3 repeated quarterly | |||
Phase 1 |
Phase 2 |
Phase 3 |
|
1.1 Define the reporting framework and service levels. 1.2 Collect and consolidate IT spend and staffing data. One-time setup (with ITSS Benchmarking) |
2.1 Extract and map spend data to ITFM taxonomy. |
3.1 Analyze variances and trends
|
3.2 Build a reporting package for key stakeholders.
|
Phase Outcomes
- Reporting scope defined and service levels selected for CFO, CxO, and CEO reporting packages
- IT spend and staffing data consolidated, reconciled to Finance-confirmed actuals, and ready for taxonomy classification
- Data gaps documented and formally accepted
Step 1.1
Define the Reporting Framework and Service Levels
Activities
- 1.1.1 Define the IT value reporting scope
- 1.1.2 Select service levels and prepare tools
This step involves the following participants:
- CIO/head of IT
- IT finance lead
Outcomes of this step
- Reporting scope confirmed across stakeholder audiences, data sources, and organizational boundaries
- Service levels selected for CFO, CxO, and CEO reporting packages and tools prepared for use in Step 1.2
Gather IT Spend and Staffing Data
| Step 1.1 | Step 1.2 | Step 2.1 | Step 3.1 | Step 3.2 |
IT value reporting often fails to resonate with decision-makers
Too often, IT value reporting fails because it is too focused on technology and doesn’t connect with its key audiences: the CFO, the CEO, and CxOs.
IT value reporting commonly falls short because it is framed around technology rather than the priorities of the CFO, CEO, and other CxOs who use it to make funding, governance, and strategy decisions.
Pitfalls include reports that:
- Reflect siloed thinking rather than enterprise priorities.
- Go too deep on technology and costs and not far enough on business impact.
- Do not capture the attention of decision-makers in a meaningful way.
To be effective, reporting scope must connect IT investments to stakeholder concerns, business outcomes, and clear value narratives.
To be effective, reporting scope must connect IT efforts to the business outcomes they drive for specific business groups and stakeholders.
CEOs | 36% — In a recent IBM study, only 36% of surveyed CEOs felt their IT organization was effective at delivering basic services (down from 64% in 2013) (IBM, 2024)
CFOs | 50% — In the same survey, in response to the same question, only 50% of CFOs felt IT was effective (down from 60% in 2013). (IBM, 2024)
When IT value is not communicated, IT is perceived as falling short
Poor value communication does more than hurt IT’s reputation: It can diminish IT’s strategic mandate.
Data from Info-Tech’s CxO-CIO Alignment Diagnostic shows that most C-suite leaders rate their IT functions as firefighters.
- Meanwhile, data from that same diagnostic shows that 93% of C-suite leaders say that the desired target state for their IT department is the level of Trusted Operator or above, revealing that IT is perceived as not meeting its organization mandate.
- Tailored IT value reporting can reshape this perception by connecting IT’s contribution to the priorities of executive stakeholders.
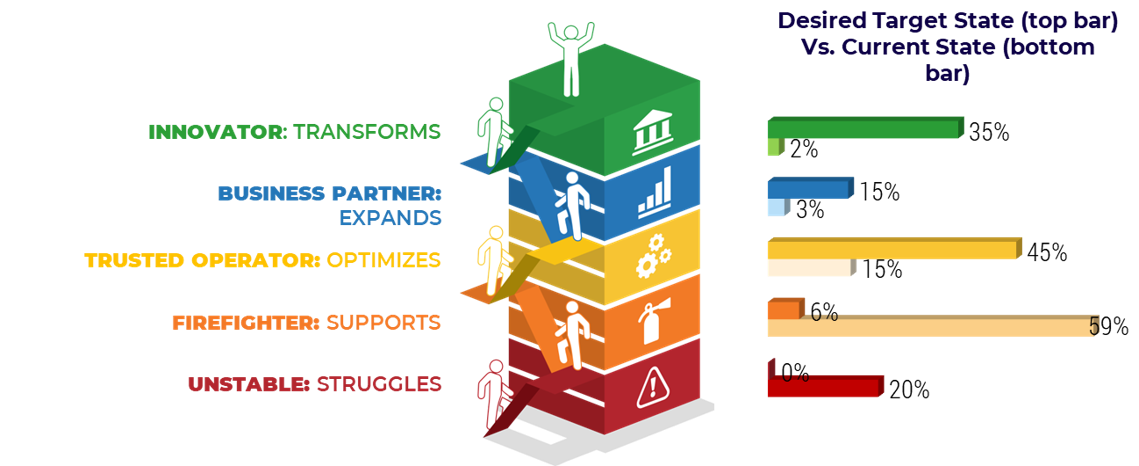 (Source: CxO-CIO Alignment Diagnostic; N=371 CxOs; 2023-Jan to 2024-Dec)

About Info-Tech
Info-Tech Research Group is the world’s fastest-growing information technology research and advisory company, proudly serving over 30,000 IT professionals.
We produce unbiased and highly relevant research to help CIOs and IT leaders make strategic, timely, and well-informed decisions. We partner closely with IT teams to provide everything they need, from actionable tools to analyst guidance, ensuring they deliver measurable results for their organizations.
What Is a Blueprint?
A blueprint is designed to be a roadmap, containing a methodology and the tools and templates you need to solve your IT problems.
Each blueprint can be accompanied by a Guided Implementation that provides you access to our world-class analysts to help you get through the project.
Need Extra Help?
Speak With An Analyst
Get the help you need in this 4-phase advisory process. You'll receive multiple touchpoints with our researchers, all included in your membership.
Guided Implementation 1: Introduction
- Call 1: Scope requirements, objectives, and your specific challenges.
Guided Implementation 2: Map Spend
- Call 1: Customize ITFM taxonomy.
- Call 2: Map spend to taxonomy.
Guided Implementation 3: Prepare Value Inputs
- Call 1: Create a budget variance visual.
- Call 2: Determine project benefits data.
- Call 3: Determine IT's value contributions.
Guided Implementation 4: Prepare to Report
- Call 1: Customize Info-Tech's IT value reports templates with your inputs.
- Call 2: Conduct final review and prepare to present.
 Create a Transparent and Defensible IT Budget
 Take a Holistic Approach to IT Financial Management
 Increase Grant Application Success
 Manage an IT Budget
 Establish a Service-Based Costing Model
 Implement an IT Chargeback System
 Build Your IT Cost Optimization Roadmap
 Take Control of Cloud Costs on AWS
 Take Control of Cloud Costs on Microsoft Azure
 Cost-Reduction Planning for IT Vendors
 Start Making Data-Driven People Decisions
 Maximize Your American Rescue Plan Funding
 Achieve IT Spend & Staffing Transparency
 Develop a Flexible IT Funding Model
 Develop Your IT Leadership Team’s Financial Literacy
 Adopt a World-Class ITFM Taxonomy
 Implement an Adaptive System for IT Financial Management
 IT Spend and Staffing Benchmarking: Realign Resources for Success
 Stop Wasting Time Evaluating Commoditized Products and Services
 Build an ITFM Improvement Roadmap
 IT Spend and Staffing Benchmarking
 Adapt to Uncertainty: Optimize Your Top Areas of IT Spend
 Invest in Realistic and Comprehensive Project Costing
 Demonstrate IT Value Through ITFM Reporting