Where does the time go?
We’ve been asking this question for years. We don’t mean it rhetorically, like when the kids grow up and move away or, heaven forbid, get their own cell phone plan. And we aren’t asking for a time sheet system, where our staff assure us on Friday afternoon that they spent 35 hours this week focused on their big project, diligently rejecting all other invitations to help their coworkers and responsibly refusing to talk about that Netflix series everyone’s binge watching.
No, when we ask where the time goes, we are trying to figure out if the capacity we allocated for project work is actually being realized. We’re trying to understand the extent to which we’re wasting resources. We’re trying to figure out if we’re approving the right amount of project work, if we’re pushing the staff too hard or setting our expectations too low.
We’re trying to understand if we’re acting as prudent stewards of that massively expensive and paralyzingly scarce resource called “knowledge worker capacity.”
The capacity is represented in a pie graph we affectionately call the “Wheel-O-Waste.” It’s a pie chart because the outer boundary is established by the number of hours you’ve allocated to project work by approving projects. The pie has six slices, and one of them represents, for lack of a better term, “project hours as intended.” The other five are various flavors of waste.
When we began this line of inquiry in 2014, there was a solid base of observations suggesting that estimation was a problem. It was self-evident, right? Lots of tasks go over their estimate, and we’re late with most of our projects.
Well, not so fast. If it were that simple, we’d solve the world’s project ills by taking courses on estimation. While it was likely true that project tasks were estimated poorly, the larger problem was the estimate of how much time we had to spend on the project in the first place. And how much of that time was focused high-quality work effort, not diluted by interruption or the pipe-dream of multi-tasking?
Categories of Waste
It led us to identify five categories of waste as a percentage of the overall capacity for projects. You might be skeptical right off the bat if your organization doesn’t know how much capacity you have for project work. We can help with that, but let’s assume for now that you have, for lack of a better term, an annual budget for project capacity. As in, “We have 1,000 IT people, and we assume that they have an average of four work months for project work, so our annual capacity is 4,000 work months.”
Something like that.
So, instead of asking individuals for time sheets and other forms of utilization study, we asked the managers and executives what percentage of your capacity:
- Is spent on projects that get cancelled?
- Is allocated for project work, without having project work assigned?
- Is spent analyzing, fixing, and re-deploying work from past projects?
- Note: Those first three, unless you convince us otherwise, are pure waste.
- Is assigned to someone with suboptimal skill sets (for example, having database developers building user interfaces)?
- Is otherwise inefficient (such as re-building test environments in four hours that could have been restored from image in ten minutes)?
- Note: Those last 2 are not 100% wasteful.
Surely, it’s not a surprise that few people have this data. That, in itself, is cause for concern. But we asked anyway and the first responses were dismissed as misunderstandings. The survey questions were dismissed as misleading. The analyst’s point of view was dismissed as misguided. The survey results were dismissed as misstated.
We interviewed the survey respondents in depth and continually found that they interpreted the questions as we intended, that they weren’t surprised by the results and our interpretation. They may not have realized that the problem is so widespread, but they fully expected their own results to be portrayed as we reported them.
It’s now been four years, with over 400 organizations going through the experience. Here is the average, expressed in our handy-dandy Wheel-O-Waste format:
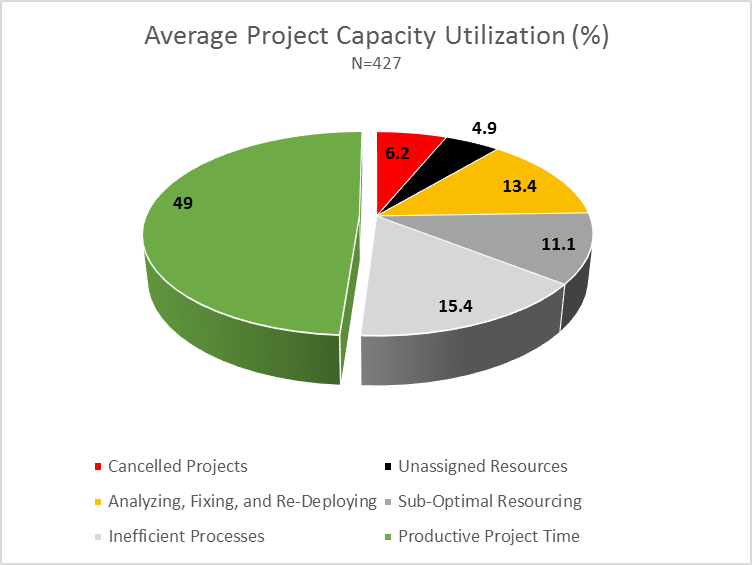
That’s right, after four years and 427 responses, the average project organization thinks they’re productively spending 49% of the capacity intended for projects.
But that’s just the average.
Take a comfy seat.
Put down anything hot or sharp and set it more than an arm’s length away.
Breathe.
Here is the “Healthcare” cohort:
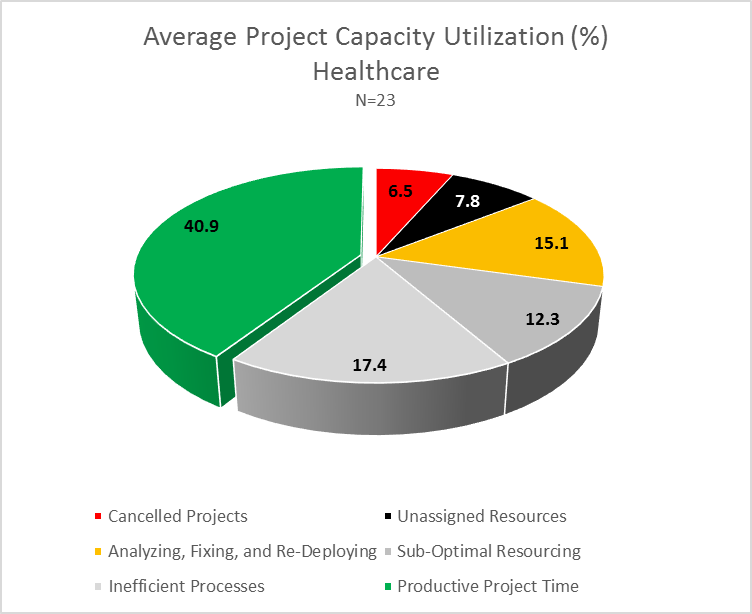
In other words, Healthcare IT departments think they’re productively spending 40.9% of the capacity intended for projects.
We can debate the results with ease, since the typical respondent is guessing. And we can debate the gap between Healthcare and the average too. For example, it would be easy to take a position that your technology is about life and death scenarios, driving up the testing-related cost of fixing defects from past projects, for example (that’s the orange 15.1% in the chart above). It’s bound to be worse than Higher Education’s cost of assuring that you handled the grades properly for that “Introduction to Study of the Future” course.
And hey, we all know that the Healthcare technology spending is severely constrained these days, regardless of the country you’re in. As a result, it’s easy to buy into a nasty number for suboptimal resource skills since turnover is high and compensation isn’t always competitive.
But what’s with the 7.8% on “Unassigned Resources”? When we interview on that topic, it mostly sounds like this: “Our managers and project managers are too busy to give people work sometimes. So, they do non-project work or, well, who knows?”
Solving the Problem
None of us wants to just bellyache about the resource management problem without identifying solutions. But sadly, few want to (or are able to) take the corrective actions.
Let’s start with “cancelled projects.” To reduce this, you have to get way better at avoiding them in the first place. But this flies in the face of our transition to Agile, where the bar for starting a project has been dramatically lowered. Hence, the chance of starting the wrong project is dramatically higher, and thus the likelihood of spending resources on a project that gets cancelled climbs steadily.
Hopefully things will never get as confusing as 10-15 years ago, when projects were getting cancelled because they were contradicting each other. How many of you remember having EMR projects getting cancelled because they couldn’t make sense of the HIPAA requirements, and vice versa? Makes me tear up a bit just thinking about it.
And the “unassigned resources” problem? We just expect our people to be diligent in choosing what they work on. It’s not like we’re about to add back that layer of supervisors and revert to single-tasking. But it would work pretty well if we did – we could ensure that everyone has perfect utilization if we had the right amount of supervision and planning. But wait, that’s why we empowered the worker! Dizzy yet?
Could we reduce the percentage of resource capacity spent analyzing, fixing, and redeploying? For sure, if we spent enough on testing and accepted the inevitable impact on project delivery dates. We would be guaranteed to spend more on the project, and highly likely to spend less on fixes later. Is that inspiring enough?
The softer areas of waste based on inefficiency and suboptimal resource assignment would require spending to reduce. You’d have to hire more or different people, and you’d have to stop the world every now and again to get your collective crap together (it’s what we used to call “Process Reengineering”).
Building your awareness of these issues has proven to be an effective approach to starting the turnaround. Simply asking the questions and tracking the estimated waste is the first step. Before long, it’s not unreasonable to discuss the types of solutions described above because that Wheel-O-Waste strikes terror into the hearts of all who see their own data in there.
Recommendations
Get control of the resource capacity question:
- Determine the organization’s capacity for project work.
- Get started with tracking waste by measuring the capacity invested in cancelled projects.
- Use Info-Tech’s PPM Current State Scorecard diagnostic to formalize a program of improvement in this area.
Bottom Line
With few exceptions, project capacity waste has hit epidemic levels. We’re either squandering some of that capacity or naively over-estimating it to begin with.
Want to Know More?
Develop a Project Portfolio Management Strategy
Balance Supply and Demand with Realistic Resource Management Practices