Develop Meaningful Service Metrics
Reinforce service orientation in your IT organization by ensuring your IT metrics generate value-driven resource behavior.
- IT organizations measure services from a technology perspective but rarely from a business goal or outcome perspective.
- Most organizations do a poor job of identifying and measuring service outcomes over the duration of a service’s lifecycle – never ensuring the services remain valuable and meet expected long-term ROI.
Our Advice
Critical Insight
- Service metrics are critical to ensuring alignment of IT service performance and business service value achievement.
- Service metrics reinforce positive business and end-user relationships by providing user-centric information that drives responsiveness and consistent service improvement.
- Poorly designed metrics drive unintended and unproductive behaviors that have negative impacts on IT and produce negative service outcomes.
Impact and Result
Effective service metrics will provide the following service gains:
- Confirm service performance and identify gaps.
- Drive service improvement to maximize service value.
- Validate performance improvements while quantifying and demonstrating business value.
- Ensure service reporting aligns with end-user experience.
- Achieve and confirm process and regulatory compliance.
Which will translate into the following relationship gains:
- Embed IT into business value achievement.
- Improve the relationship between the business and IT.
- Achieve higher customer satisfaction (happier end users receiving expected service, the business is able to identify how things are really performing).
- Reinforce desirable actions and behaviors from both IT and the business.
Member Testimonials
After each Info-Tech experience, we ask our members to quantify the real-time savings, monetary impact, and project improvements our research helped them achieve. See our top member experiences for this blueprint and what our clients have to say.
Client
Experience
Impact
$ Saved
Days Saved
University of Ottawa
Workshop
8/10
$25,000
14
Best: Adequate time to do the work. being able to afford the time to dig deeper into the KPIs. Executive review at the end. Good management of doin... Read More
Commonwealth of Virginia - Office of the Attorney General
Guided Implementation
10/10
$13,600
10
Best part: - The analyst used examples I'm familiar with (applications and databases, human body, etc.) so it was relatable and easier to underst... Read More
Akin Gump Strauss Hauer & Feld LLP
Guided Implementation
9/10
N/A
6
University of Wisconsin-Madison
Guided Implementation
10/10
$108K
60
Best: Tony gaining understanding and validating our experience and position in developing a metric model. Framing how we can start to use the metr... Read More
Clark Pacific
Guided Implementation
9/10
$544K
N/A

Performance Measurement
Measure IT right and measure it well.
Please note this course is scheduled to be updated in 2026.
- Course Modules: 4
- Estimated Completion Time: 1.5-2 hours
Develop Meaningful Service Metrics
Select IT service metrics that drive business value.
ANALYST PERSPECTIVE
Are you measuring and reporting what the business needs to know?
“Service metrics are one of the key tools at IT’s disposal in articulating and ensuring its value to the business, yet metrics are rarely designed and used for that purpose.
Creating IT service metrics directly from business and stakeholder outcomes and goals, written from the business perspective and using business language, is critical to ensuring that the services that IT provides are meeting business needs.
The ability to measure, manage, and improve IT service performance in relation to critical business success factors, with properly designed metrics, embeds IT in the value chain of the business and ensures IT’s focus on where and how it enables business outcomes.”
Valence Howden,
Senior Manager, CIO Advisory
Info-Tech Research Group
Our understanding of the problem
This Research Is Designed For:
|
This Research Will Help You:
|
This Research Will Also Assist:
|
This Research Will Help Them
|
Executive summary
Situation
- IT organizations measure services from a technology perspective yet rarely measure services from a business goal/outcome perspective.
- Most organizations do a poor job of identifying and measuring service outcomes over the duration of a service’s lifecycle – never ensuring the services remain valuable and meet expected long-term ROI.
Complication
- IT organizations have difficulty identifying the right metrics to demonstrate the value of IT services to the business in tangible terms.
- IT metrics, as currently designed, reinforce division between the IT and business perspectives of service performance. They drive siloed thinking and finger-pointing within the IT structure, and prevent IT resources from understanding how their work impacts business value.
Resolution
- Our program enables IT to develop the right service metrics to tie IT service performance to business value and user experience.
- Ensure the metrics you implement have immediate stakeholder value, reinforcing alignment between IT and the business while influencing behavior in the desired direction.
- Make sure that your metrics are defined in relation to the business goals and drivers, ensuring they will provide actionable outcomes.
Info-Tech Insight
- Service metrics are critical to ensuring alignment of IT service performance and business service value achievement.
- Service metrics reinforce positive business and end-user relationships by providing user-centric information that drives responsiveness and consistent service improvement.
- Poorly designed metrics drive unintended and unproductive behaviors, which have negative impacts on IT and produce negative service outcomes.
Service metrics 101
What are service metrics?Service metrics measure IT services in a way that relates to a business outcome. IT needs to measure performance from the business perspective using business language. |
Why do we need service metrics?
To ensure the business cares about the metrics that IT produces, start with business needs to make sure you’re measuring the right things. This will give IT the opportunity talk to the right stakeholders and develop metrics that will meet their business needs. Service metrics are designed with the business perspective in mind, so they are fully aligned with business objectives. |
| Perspectives Matter
Different stakeholders will require different types of metrics. A CEO may require metrics that provide a snapshot of the critical success of the company while a business manager is more concerned about the performance metrics of their department. |
What are the benefits of implementing service metrics?
Service metrics help IT communicate with the business in business terms and enables IT to articulate how and where they provide business value. Business stakeholders can also easily understand how IT services contribute to their success. |
The majority of CIOs feel metrics relating to business value and stakeholder satisfaction require significant improvement
| A significantly higher proportion of CIOs than CEOs feel that there is significant improvement necessary for business value metrics and stakeholder satisfaction reporting. |  N=364 N=364
|
 N=364
N=364
Meaningless metrics are a headache for the business
A major pitfall of many IT organizations is that they often provide pages of technical metrics that are meaningless to their business stakeholders.
|
When considering only CEOs who said that stakeholder satisfaction reporting needed significant improvement, the average satisfaction score goes down to 61.6%, which is a drop in satisfaction of 12%.
|

Poorly designed metrics hurt IT’s image within the organization
By providing metrics that do not articulate the value of IT services, IT reinforces its role as a utility provider and an outsider to strategic decisions.
| When the CIOs believe business value metrics weren’t required, 50% of their CEOs said that significant improvements were necessary.
|
|

Articulate meaningful service performance that supports the achievement of business outcomes
Service metrics measure the performance of IT services and how they enable or drive the activity outcomes.
A business process consists of multiple business activities. In many cases, these business activities require one or more supporting IT services.

|
For each business process, business stakeholders and their goals and objectives should be identified.
For each business activity that supports the completion of a business process, define the success criteria that must be met in order to produce the desirable outcome. Identify the IT services that are used by business stakeholders for each business activity. Measure the performance of these services from a business perspective to arrive at the appropriate service metrics. |
Differentiate between different types of metrics
Stakeholders have different goals and objectives; therefore, it is critical to identify what type of metrics should be presented to each stakeholder.
Business Metrics
Determine Business SuccessBusiness metrics are derived from a pure business perspective. These are the metrics that the business stakeholders will measure themselves on, and business success is determined using these metrics. |
|
Service Metrics
Manage Service Value to the BusinessService metrics are used to measure IT service performance against business outcomes. These metrics, while relating to IT services, are presented in business terms and are tied to business goals. |
|
IT Metrics
Enable Operational ExcellenceIT metrics are internal to the IT organization and used to manage IT service delivery. These metrics are technical, IT-specific, and drive action for IT. They are not presented to the business, and are not written in business language. |
Implementing service metrics is a key step in becoming a service provider and business partner
As a prerequisite, IT organizations must have already established a solid relationship with the business and have a clear understanding of its critical business-facing services.
At the very least, IT needs to have a service-oriented view and understand the specific needs and objectives associated with each stakeholder.

Once IT can present service metrics that the business cares about, it can continue on the service provider journey by managing the performance of services based on business needs, determine and influence service demand, and assess service value to maximize benefits to the business.
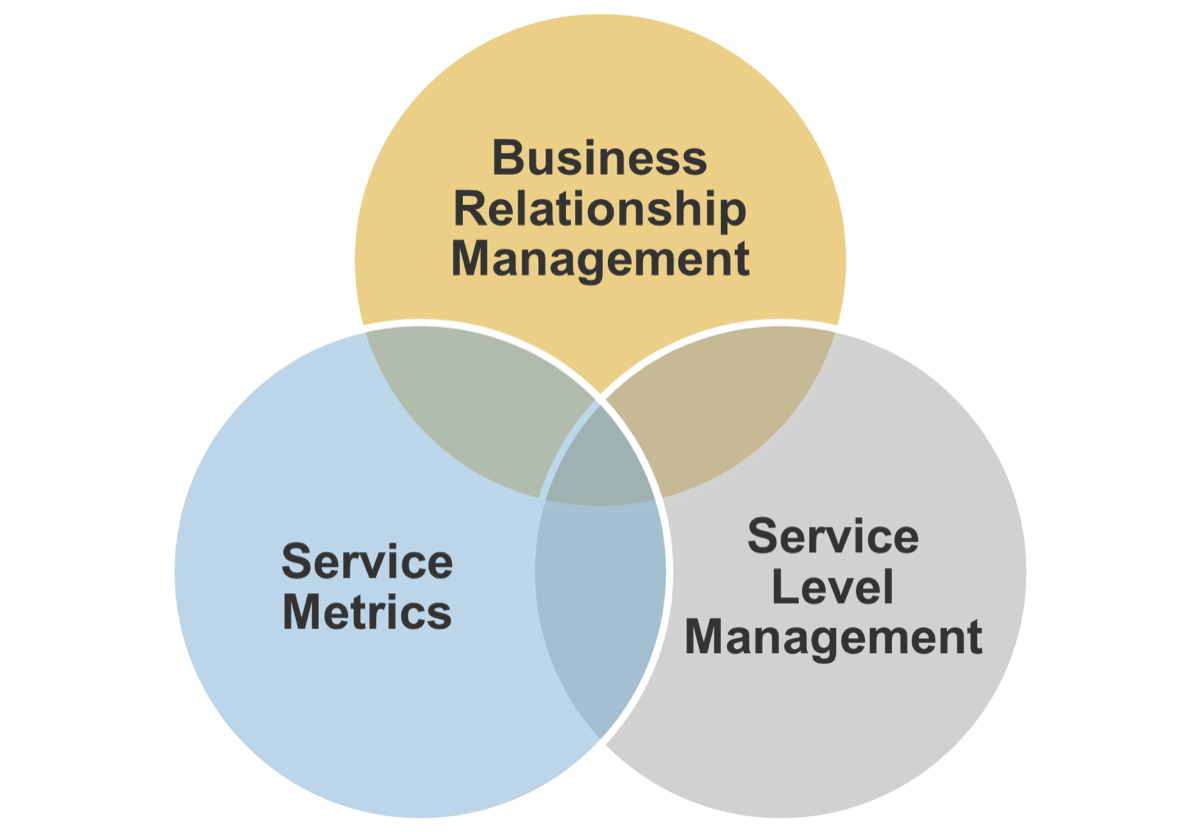
Which processes drive service metrics?
Both business relationship management (BRM) and service level management (SLM) provide inputs into and receive outputs from service metrics.
|
Business Relationship ManagementBRM works to understand the goals and objectives of the business and inputs them into the design of the service metrics. Service MetricsBRM leverages service metrics to help IT organizations manage the relationship with the business. BRM articulates and manages expectations and ensures IT services are meeting business requirements. |
Which processes drive service metrics?
Both BRM and SLM provide inputs into and receive outputs from service metrics.
| Service Level ManagementSLM works with the business to understand service requirements, which are key inputs in designing the service metrics. Service MetricsSLM leverages service metrics in overseeing the day-to-day delivery of IT services. It ensures they are provided to meet expected service level targets and objectives. |
Effective service metrics will deliver both service gains and relationship gains
Effective service metrics will provide the following service gains:
- Confirm service performance and identify gaps
- Drive service improvement to maximize service value
- Validate performance improvements while quantifying and demonstrating business value
- Ensure service reporting aligns with end-user experience
- Achieve and confirm process and regulatory compliance
- Which will translate into the following relationship gains:
- Embed IT into business value achievement
- Improve relationship between the business and IT
- Achieve higher customer satisfaction (happier end users receiving expected service, the business is able to identify how things are really performing)
- Reinforce desirable actions and behaviors from both IT and the business
Don’t let conventional wisdom become your roadblock
Conventional Wisdom |
Info-Tech Perspective |
| Metrics are measured from an application or technology perspective | Metrics need to be derived from a service and business outcome perspective. |
| The business doesn’t care about metrics | Metrics are not usually designed to speak in business terms about business outcomes. Linking metrics to business objectives creates metrics that the business cares about. |
| It is difficult to have a metrics discussion with the business | It is not a metrics/number discussion, it is a discussion on goals and outcomes. |
| Metrics are only presented for the implementation of the service, not the ongoing outcome of the service | IT needs to focus on service outcome and not project outcome. |
| Quality can’t be measured | Quality must be measured in order to properly manage services. |
Our three-phase approach to service metrics development
Let Info-Tech guide you through your service metrics journey
1 |
2 |
3 |
| Design Your Metrics | Develop and Validate Reporting | Implement, Track, and Maintain |

|

|

|
| Start the development and creation of your service metrics by keeping business perspectives in mind, so they are fully aligned with business objectives. | Identify the most appropriate presentation format based on stakeholder preference and need for metrics. | Track goals and success metrics for your service metrics programs. It allows you to set long-term goals and track your results over time. |
CIOs must actively lead the design of the service metrics program
The CIO must actively demonstrate support for the service metrics program and lead the initial discussions to determine what matters to business leaders.
- Lead the initiative by defining the need
Show visible support and demonstrate importance - Articulate the value to both IT and the business
Establish the urgency and benefits - Select and assemble an implementation group
Find the best people to get the job done - Drive initial metrics discussions: goals, objectives, actions
Lead brainstorming with senior business leaders - Work with the team to determine presentation formats and communication methods
Identify the best presentation approach for senior stakeholders - Establish a feedback loop for senior management
Solicit feedback on improvements - Validate the success of the metrics
Confirm service metrics support business outcomes
Measure the success of your service metrics
It is critical to determine if the designed service metrics are fulfilling their intended purpose. The process of maintaining the service metrics program and the outcomes of implementing service metrics need to be monitored and tracked.
| Validating Service Metrics Design | |
Target Outcome |
Related Metrics |
| The business is enabled to identify and improve service performance to their end customer | # of improvement initiatives created based on service metrics $ cost savings/revenue generated due to actions derived from service metrics |
|
Procedure to validate the usefulness of IT metrics |
# / % of service metrics added/removed per year |
| Alignment between IT and business objectives and processes | Business’ satisfaction with IT |
Measure the success of your service metrics
It is critical to determine if the designed service metrics are fulfilling their intended purpose. The process of maintaining the service metrics program and the outcomes of implementing service metrics need to be monitored and tracked.
| Validating Service Metrics Process | |
Target Outcome | Related Metrics |
| Properly defined service metrics aligned with business goals/outcomes Easy understood measurement methodologies | % of services with (or without) defined service metrics % of service metrics tied to business goals |
| Consistent approach to review and adjust metrics | # of service metrics adjusted based on service reviews % of service metrics reviewed on schedule |
Demonstrate monetary value and impact through the service metrics program
In a study done by the Aberdeen Group, organizations engaged in the use of metrics benchmarking and measurement have:
|
A service metric is defined for: “Response time for Business Application A”
The expected response time has not been achieved and this is visible in the service metrics. The reduced performance has been identified as having an impact of $250,000 per month in lost revenue potential. The service metric drove an action to perform a root-cause analysis, which identified a network switch issue and drove a resolution action to fix the technology and architect redundancy to ensure continuity. The fix eliminated the performance impact, allowing for recovery of the $250K per month in revenue, improved end-user confidence in the organization, and increased use of the application, creating additional revenue. |


About Info-Tech
Info-Tech Research Group is the world’s fastest-growing information technology research and advisory company, proudly serving over 30,000 IT professionals.
We produce unbiased and highly relevant research to help CIOs and IT leaders make strategic, timely, and well-informed decisions. We partner closely with IT teams to provide everything they need, from actionable tools to analyst guidance, ensuring they deliver measurable results for their organizations.
What Is a Blueprint?
A blueprint is designed to be a roadmap, containing a methodology and the tools and templates you need to solve your IT problems.
Each blueprint can be accompanied by a Guided Implementation that provides you access to our world-class analysts to help you get through the project.
Need Extra Help?
Speak With An Analyst
Get the help you need in this 3-phase advisory process. You'll receive multiple touchpoints with our researchers, all included in your membership.
Guided Implementation 1: Design the metrics
- Call 1: Design metrics based on business needs
- Call 2: Validate the metrics
Guided Implementation 2: Design reports and dashboards
- Call 1: Select presentation format
- Call 2: Review metrics presentation design
Guided Implementation 3: Implement, track, and maintain metrics
- Call 1: Select and implement pilot metrics
- Call 2: Determine rollout process and establish maintenance/tracking mechanism
Contributors
- Joe Evers, Joe Evers Consulting
- Glen Notman, Associate Partner, Citihub
- David Parker, Client Program Manager, eHealth Ontario
- Marianne Doran Collins, CIO, The CIO-Suite, LLC
- Chris Kalbfleisch, Manager, Service Management, eHealth Ontario
- Joshua Klingenberg, BHP Billiton Canada Inc.
 Design a Service Catalog That Drives Insight and Innovation
 Create a Service Management and IT Operations Strategy
 Develop a Plan to Pilot Enterprise Service Management
 Create a Service Management Roadmap
 Elevate Your Service Capabilities to Drive Enterprise Value
 Create an IT View of the Service Catalog
 Initiate Your Service Management Program
 Develop Meaningful Service Metrics
 IT Service Management Selection Guide
 Service Management Integration With Agile Practices
 Define Your Enterprise IT and Digital Services
 Fast-Track Your Enterprise Service Design