Business Intelligence and Analytics Platform Selection Guide
Accelerate the process of building your business case and selecting your business intelligence and analytics solution.
- Selecting and implementing a business intelligence (BI) and analytics platform that aligns with your requirements is a significant undertaking.
- Despite the importance of selecting and implementing the right platform, many organizations struggle to define an approach to picking the most appropriate vendor and rolling out the solution in an effective and cost-efficient manner.
- IT often finds itself in the unenviable position of taking the blame for BI and analytics platforms that fail to meet functional requirements.
Our Advice
Critical Insight
- Determine what exactly you require from your BI and analytics solution; platform selection must be driven by your major use cases and usage patterns.
- Don’t be afraid to adopt multiple tools, if necessary. Trying to coerce drastically different usage patterns from a single technology will be detrimental in the long run.
- Ensure that your new BI and analytics platform fits into your existing environment without creating any functional gaps or overlapping capabilities.
Impact and Result
Completing this project will result in:
- A clear, concise, and compelling BI RFP and a detailed requirements picklist.
- A BI and analytics platform that effectively meets business needs and delivers value.
- Reduced costs during BI and analytics platform selection and faster time to results after implementation.
Member Testimonials
After each Info-Tech experience, we ask our members to quantify the real-time savings, monetary impact, and project improvements our research helped them achieve. See our top member experiences for this blueprint and what our clients have to say.
8.0/10
Overall Impact
$136,000
Average $ Saved
20
Average Days Saved
Client
Experience
Impact
$ Saved
Days Saved
Republic Services
Workshop
8/10
$136K
20
The best part of this was to get all the stakeholders in one room and work on a vision and mission for BI and Analytics
Business Intelligence and Analytics Platform Selection Guide
Accelerate the process of building your business case and selecting your business intelligence and analytics solution.
Analyst Perspective
The business intelligence and analytics software market has always been dynamic and diversified; there are no distinct and permanent leaders – every platform is different.
Business intelligence (BI) and analytics software is what data consumers are looking at. Perspectives are different, use cases are different, and data inquiry complexity varies greatly – hence, there is a great degree of variability in features, functions, and characteristics of BI and analytics tools. For example, tools may:
- Be extremely business user friendly but lack the sophistications of analytical insights.
- Be designed for technically savvy users who don’t mind writing code to solve highly complex problems.
- Be “all-in-one” platforms with built-in data preparation pipeline capabilities.
- Be specialized and require minimal effort to create reports and dashboards in their specific niche.
- Use machine learning (ML) and artificial intelligence (AI) to process complex predictive logic or use AI to better understand data and empower smart search capabilities.
What to consider when selecting a BI/reporting/analytics tool or platform:
- Start with your major use cases and usage patterns – if you realize that more than one tool is needed, don’t feel embarrassed, this is typical for many organizations.
- Consider related capabilities, i.e. master data management, data augmentation, ML, AI, etc., so that your BI/analytics platform fits into your environment without creating functional gaps or redundancies.
- Ensure that the new platform is not just a visually entertaining terminal, but an integral part of continuous improvements throughout core business processes. This can be viewed as “following a circle”: business action › data creation › collection › augmentation › consumption › new insights › business action.

|
Igor Ikonnikov
Principal Advisory Director, Data & Analytics Info-Tech Research Group |
Executive Summary
Your Challenge
- BI and analytics solutions are becoming increasingly essential tools, transforming organizational data into actionable insights that inform and guide decision-making processes. But selecting a platform that aligns with your requirements is a significant undertaking.
- After defining an approach to BI, selecting and implementing the right BI and analytics platform is a crucial step in delivering concrete business value.
Common Obstacles
- It is difficult to stay on top of the vast and rapidly evolving BI and analytics market.
- Despite the importance of selecting and implementing the right BI and analytics platform, many organizations struggle to define an approach to picking the most appropriate vendor and rolling out the solution in an effective and cost-efficient manner.
- IT often finds itself in the unenviable position of taking the fall for BI and analytics platforms that don’t meet functional requirements.
Info-Tech’s Approach
- Determine what you require from your BI and analytics solution; platform selection must be driven by your major use cases and usage patterns.
- If more than one tool is needed, adopt multiple. Trying to coerce drastically different usage patterns from a single technology (that is expected to save your company money) might eventually cost you more money – and time.
- Ensure that your new BI and analytics platform fits into your existing environment without creating any functional gaps or overlapping capabilities.
Info-Tech Insight
It is integral that IT work with other relevant stakeholders throughout the organization to define a unified vision for the desired BI and Analytics platform. BI and analytics tools are designed with different use cases – and user abilities – in mind.
Info-Tech’s methodology for selecting the right BI and analytics platform
1. Contextualize the Landscape |
2. Select the Right Vendor |
|
Phase Steps |
|
|
Phase Outcomes |
|
|
Need help constructing your RFP? Use Info-Tech’s Business Intelligence RFP Template.
Guided Implementation
A GI is a series of calls with an Info-Tech analyst to help implement our best practices in your organization.
The BI and analytics platform selection process should be broken into segments:
- BI and analytics vendor shortlisting – with this buyer’s guide
- Structured approach to selection
- Contract review
What does a typical guided implementation (GI) on this topic look like?
Phase 1 |
Phase 2 |
| Call #1: Understand what a BI and analytics platform is and discover the benefits that they can bring your organization.
Call #2: Build the business case to select a BI and analytics platform. |
Call #3: Define your key BI and analytics requirements.
Call #4: Build procurement items, such as an RFP. Call #5: Evaluate the BI and analytics solution landscape and shortlist viable options. |
Info-Tech offers varying levels of support for your needs
DIY Toolkit |
Guided Implementation |
Workshop |
Consulting |
| “Our team has already made this initiative a priority, and we have the time and capability, but some research along the way would be helpful.” | “Our team knows that we need improve, but we need assistance to determine where to focus. Some check-ins with an expert along the way would help keep us on track.” | “We need to hit the ground running and get this project kicked off immediately. Our team has the ability to take this over once we get a framework and strategy in place.” | “Our team does not have the time or the knowledge to take this initiative on. We need assistance through the entirety of this project.” |
Diagnostics and consistent frameworks are used throughout all four options. |
|||
EXECUTIVE BRIEF
What exactly is a BI and analytics platform?
BI and analytics platforms are software solutions that collect, store, and process unstructured data, transforming said data into actionable insights that can be used to inform an organization's strategic and tactical business decisions.
BI tools provide numerous benefits. They integrate data into compelling visualizations – ensuring transparency across entire organizations – and they track key business metrics, empowering improved decision making.
BI and analytics platforms offer various key features, including but not limited to:
- Advanced analytics and data science
- Dashboards and enterprise-wide perspectives
- Self-service and ad hoc capabilities
- Operational reporting capabilities
- Spatial analysis
- Real-time visualization
- Data connectors and data mashup
- Collaboration
- Mobile delivery
- BI security
Info-Tech Insight
BI and analytics platforms are becoming must-have solutions for organizations, regardless of business size or industry of focus. These impactful tools not only drive improved decision making but also increase efficiency, accuracy, and profitability.
How it got here: the evolution of BI
The origin of BI traces back to pen and paper.
1865 |
1890s |
1958 |
1970 |
2000s |
| The term “business intelligence” is first used in the “Cyclopædia of Commercial and Business Anecdotes.” Penned by Mr. Richard Miller, the term is used to describe how a banker had profited by “actively gathering and acting” on information. | Frederick Taylor’s theory of scientific management becomes the United States’ first formalized system of business analytics. “Taylorism” aimed to improve operational efficiencies and increase worker productivity. | IBM researcher Hans Peter Luhn publishes “A Business Intelligence System.” In this paper, Luhn writes about the ability of systems to “selectively disseminate” documents into “action points” based on “interest profiles.” The idea was deemed too costly at the time. | IBM employee Edgar Codd publishes “A Relational Model of Data for Large Shared Data Banks.” This paper inspires next-generation relational databases to allow for a greater capacity to record, store, and manipulate data, triggering a market boom that brought with it the first BI vendors (SAP, Siebel, etc.). | BI platforms become must-have solutions for medium and large businesses, with an increase in both website data and publicly available data (via social media) driving the need for improved data analyzation practices. |
Where it’s going: the future of BI
BI and analytics platforms are continuing to evolve.
-
An Integral Aspect of Decision-Making Processes
AI is becoming increasingly popular in vendor offerings. The inclusion of AI – either produced by the same vendor or by a third party – gives BI the propensity to turn into cognitive support services (CS services). The main difference is that traditional BI prompts insights and offers options available for decision making, while CS services create and process insights and figure out the most appropriate business decision. -
The Development of All-In-One Platforms
By adding data preparation capabilities to their offerings, several BI vendors have effectively turned their products into all-in-one platforms with end-to-end technology support (from data acquisition to data visualization). However, this can lead to some issues. The main problem observed so far: when such a platform gets into the hands of business users without proper IT support and governance, it can quickly turn into an unmanageable mess. -
An Increased Focus on the End Result
BI is all about arranging data visually so that decision makers can derive new insights from it, confirm or overturn their assumptions, or see something they may have missed. With the thirst for business-user enablement having been quenched, there will be rededicated focus, or a greater importance, placed on the end result of queries (i.e. executive and operational dashboards) rather than on the process of obtaining the result.
Key trend
AI and natural language processing (NLP)
AI frameworks are transforming how users interact with analytics and data.
AI has many application areas in BI – from automatically detecting data anomalies to generating predictive insights. However, it is widely believed that NLP will have the largest impact on the BI and analytics space.
NLP allows for BI and analytics platforms to process language much like a human would. This means that business users can type – or speak – queries in different languages, using different phrasing, and still be provided with relevant, easily digestible data.
NLP integrated chatbots are being used more frequently in BI applications. With these “BI bots,” users simply need to input their data set and their queries – which are word-based, not code – into the chat, and the bot will return the results. Beyond powering chatbots, NLP also provides the ability to conduct voice-activated searches. Voice-assisted BI applications (or voice-enabled BI) behave in much the same way as Siri and Alexa. Users can simply talk to their BI, asking questions related to their data, and the insights are then spoken back to them.
Many vendors now provide some NLP capabilities within their offerings. Examples include ThoughtSpot, whose platform was built to allow for natural language search, and Tableau, which acquired Narrative Science – a vendor with leading natural language capabilities – in 2021.
Key trend
Self-service BI
Self-service BI gives all employees – regardless of their level of technical expertise – access to data-driven insights.
Traditional business intelligence involves IT and BI staff completing data analysis work for an organization. While this does guarantee a level of data quality, it reduces efficiency. With today’s concerted emphasis on generating timely BI insights, that is an issue.
Self-service BI enables business users to ingest, visualize, and analyze data sets on their own. This ensures that data-driven insights can be used to inform all major business decisions. By empowering business users to perform their own data analysis work, self-service BI also reduces the workload of IT and BI staff, allowing them to focus instead on other valuable tasks (i.e. data quality work).
While self-service BI is designed to not require any technical expertise from its users, it does rely on users having some sort of business knowledge. Not only will they need to know which questions to ask and which data to query, but they’ll also be required to determine what appropriate actions should be taken in response to those questions and queries. This is why it is important to train employees and optimize business processes as needed.
Key trend
GIS-based analytics
GIS technology is transforming how competitive organizations view their data.
GIS, or geographic information systems, store, analyze, and map various types of data. By connecting data to a map, GIS empowers users to easily recognize any patterns – or anomalies – within their data. For this reason, many organizations are now coupling GIS with their BI tools.
Spatial BI, also often referred to as geospatial analysis or geo-intelligence, is the amalgamation of GIS and BI. Spatial BI empowers organizations to fully use the power of their location data, providing geographic insights into the critical questions they need answered.
Location intelligence can be used to inform numerous major business decisions, including analyzing and adjusting supply chains, determining optimal delivery routes, and even deciding where to expand operations and services (i.e. by identifying areas with favorable demographics). Driving growth, sustainability, efficiency, and innovation, the application areas for spatial BI are vast.
Key trend
Decentralization of data management with semantic harmonization (data fabric)
Data fabric architectures provide organizations with numerous advantages, including improved efficiency and overall productivity.
Data access is integral in establishing a data-driven culture, and while many organizations are striving toward that ideal, their progress is impeded by siloed data. Data silos – while ensuring data control – negatively impact overall data quality as well as speed and accuracy in reporting.
To combat data silos, many organizations are turning to the process of semantic harmonization, which involves combining an organization’s disparate data sources into a common, singular form. This is accomplished via a data fabric. A data fabric is an architecture that enables the integration of the various data pipelines that are in use by an organization, including on-premises and cloud data sources, to ultimately provide universal context to data and to facilitate its use. These semantic capabilities empower users to get analytical insights and answers to even the most complex queries.
With the exponential growth of big data, semantic harmonization and the unification of data environments have become top priorities for many. The use of a data fabric can provide superior data protection (owing to the development of improved data governance practices and the inclusion of data masking and encryption measures), assist with enabling self-service (by increasing data access), and improve data management practices (by grouping together relevant data across data types and endpoints).
Key trend
The rationalization of the BI market
Many vendors are rationalizing – or redesigning – their product offerings to improve their market share.
The landscape of the BI and analytics marketspace is constantly changing. Vendors that were once market leaders (i.e. DOMO) are now stalling in terms of new growth, finding themselves fighting to continue servicing existing accounts, and once viable solutions (i.e. Dundas BI) have disappeared entirely. To set themselves apart from their competition and to ensure that they can maintain – and even improve – their share of the market, many major vendors have begun rationalizing their offerings.
Vendors often rationalize their offerings via company acquisitions/mergers and making updates to their core product (such as offering a more specialized solution). Tableau and Qlik are examples of rationalization via acquisition. Tableau is backed by Salesforce, and Qlik acquired Talend to enhance its data preparation capabilities. SAP has rationalized its product offering by pushing a BI tool that is specific for an SAP environment (thus, higher-performing), whereas Microsoft rationalized its solution by making it integrable and functional across existing enterprise architecture.
BI and Analytics Platform Selection Guide
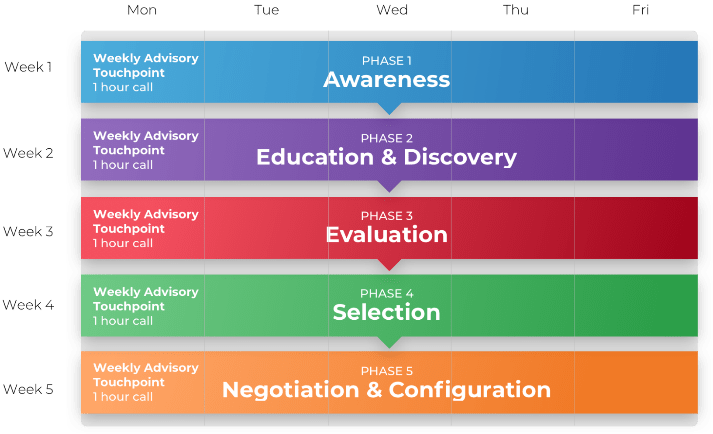
Selection process overview
Software Selection Engagement
Five advisory calls over a five-week period to accelerate your selection process.
Expert analyst guidance over five weeks on average to select and negotiate software.
Save money, align stakeholders, speed up the process, and make better decisions.
Use a repeatable, formal methodology to improve your application selection process.
Better, faster results, guaranteed, included in membership.
CLICK HERE to book your selection engagement
Elicit and prioritize granular requirements for your BI and analytics platform
Understanding business needs through requirements gathering is the key to defining everything about what is being purchased, yet it is an area where people often make critical mistakes.
Risks of poorly scoped requirements
- Fail to be comprehensive and miss certain areas of scope.
- Focus on how the solution should work instead of what it must accomplish.
- Have multiple levels of detail within the requirements that are inconsistent and confusing.
- Drill all the way down into system-level detail.
- Add unnecessary constraints based on what is done today rather than focusing on what is needed for tomorrow.
- Omit constraints or preferences that buyers think are obvious.
Best practices
- Get a clear understanding of what the system needs to do and what it is expected to produce.
- Test against the principle of MECE – requirements should be “mutually exclusive and collectively exhaustive.”
- Explicitly state the obvious and assume nothing.
- Investigate what is sold on the market and how it is sold. Use language that is consistent with that of the market and focus on key differentiators – not table stakes.
- Contain the appropriate level of detail – the level should be suitable for procurement and sufficient for differentiating vendors.
Info-Tech Insight
Review Info-Tech’s requirements gathering methodology to improve your requirements gathering process.
Info-Tech’s approach
Develop an inclusive and thorough approach to the RFP Process

The Info-Tech difference:
- The secret to managing an RFP is to make it as manageable and as thorough as possible. The RFP process should be like any other aspect of business – by developing a standard process. With a process in place, you are better able to handle whatever comes your way, because you know the steps you need to follow to produce a top-notch RFP.
- The business then identifies the need for more information about a product/service or determines that a purchase is required.
- A team of stakeholders from each area impacted gather all business, technical, legal, and risk requirements. What are the expectations of the vendor relationship post-RFP? How will the vendors be evaluated?
- Based on the predetermined requirements, either an RFI or an RFP is issued to vendors with a predetermined due date.
Info-Tech Insight
Review Info-Tech’s RFP process and understand how you can prevent your organization from leaking negotiation leverage while preventing vendors from taking control of your RFP.
Leverage the contract review service to level the playing field with your shortlisted vendors
You may be faced with multiple products, services, master service agreements, licensing models, service agreements, and more.
Use the contract review service to gain insights on your agreements.
Consider the aspects of a contract review:
- Are all key terms included?
- Are they applicable to your business?
- Can you trust that results will be delivered?
- What questions should you be asking from an IT perspective?
Validate that a contract meets IT’s and the business’ needs by looking beyond the legal terminology. Use a practical set of questions, rules, and guidance to improve your value for dollar spent.

CLICK HERE to BOOK | The Contract Review Service
DOWNLOAD | Master Contract Review and Negotiation for Software Agreements

About Info-Tech
Info-Tech Research Group is the world’s fastest-growing information technology research and advisory company, proudly serving over 30,000 IT professionals.
We produce unbiased and highly relevant research to help CIOs and IT leaders make strategic, timely, and well-informed decisions. We partner closely with IT teams to provide everything they need, from actionable tools to analyst guidance, ensuring they deliver measurable results for their organizations.
What Is a Blueprint?
A blueprint is designed to be a roadmap, containing a methodology and the tools and templates you need to solve your IT problems.
Each blueprint can be accompanied by a Guided Implementation that provides you access to our world-class analysts to help you get through the project.
Need Extra Help?
Speak With An Analyst
Get the help you need in this 2-phase advisory process. You'll receive multiple touchpoints with our researchers, all included in your membership.
Guided Implementation 1: Contextualize the landscape.
- Call 1: Understand what a BI and analytics platform is and discover the benefits that they can bring your organization.
- Call 2: Build the business case to select a BI and analytics platform.
Guided Implementation 2: Select the right vendor.
- Call 1: Define your key BI and analytics requirements.
- Call 2: Build procurement items, such as an RFP.
- Call 3: Evaluate the BI and analytics solution landscape and shortlist viable options.
 Business Intelligence and Analytics Platform Selection Guide
 Build a Reporting and Analytical Insights Strategy
 Run IT By the Numbers
 Assessing the AI Ecosystem
 Turn Customer Friction Into Agentic Opportunity
 Lead IT Like a Business: Every Dollar Is a Decision
 Influence Unleashed: The IT Leader’s Superpower
 Revolutionize Risk Management With Agentic AI