Data Analytics Use Cases for Utilities
Building upon the collective wisdom for the Art of the Possible
Your organization recognizes the importance of building a business-driven data strategy to enable digital transformation. You are having difficulty in
- Building a list of value-driven business use cases required to develop a data analytics program.
- Justifying the effort and cost to invest in the program.
- Developing a practical and agile implementation plan to help solve business data challenges.
Our Advice
Critical Insight
Demonstrating the return on investment of data analytics programs rapidly is a vital step to digitally transforming your organization.
Empower data-driven decision making by leveraging Info-Tech's approach to accelerate the process and take advantage of the collective wisdom from your community.
Impact and Result
Info-Tech’s trends deep-dive report on data analytics use case for utilities can fast track the data strategy development by:
- Accelerating your business case development by providing a curated data analytics use case repository.
- Identifying the right data problems to solve which deliver the highest value by leveraging a rapid and effective prioritization. framework.
- Developing an iterative and value proven roadmap based on your organizational scorecard.
Data Analytics
Use Cases for Utilities
Building upon the collective wisdom for the art of the possible
JING WUPrincipal Research Director,
|
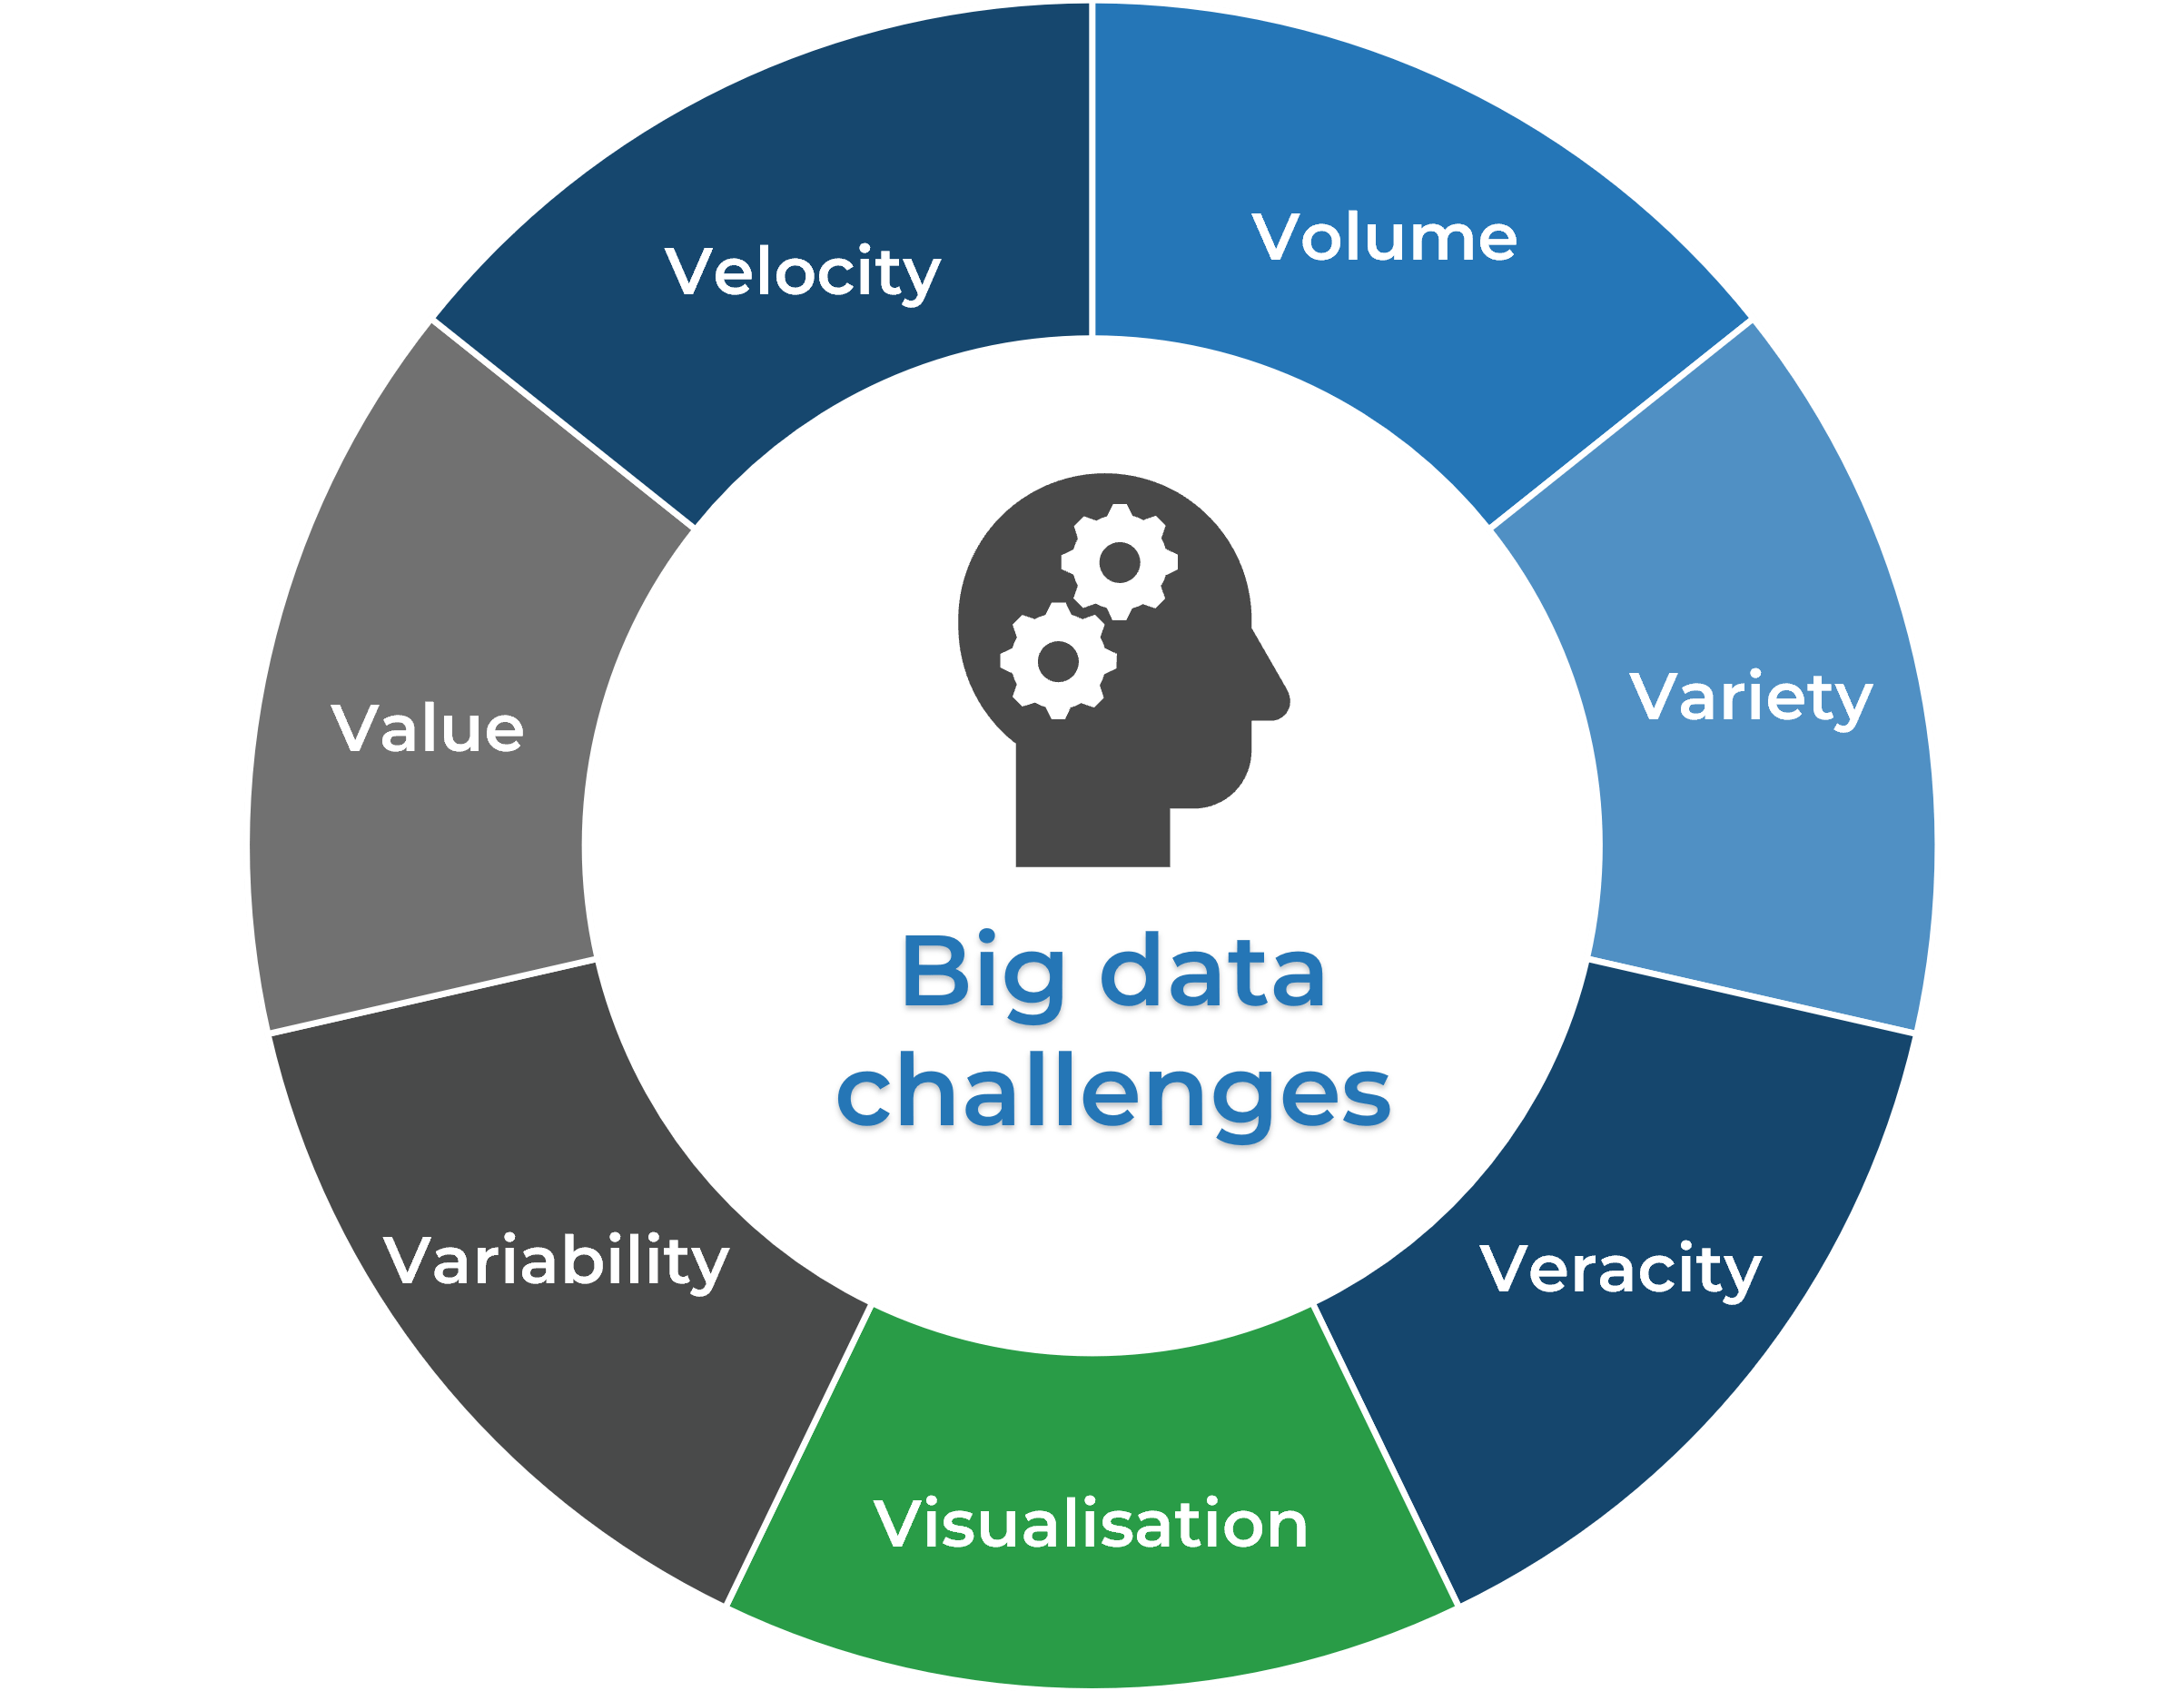
Analyst PerspectiveTransitioning to the adaptable utilities of the future, organizations are addressing unprecedented challenges through their Digital Transformation journeys. Data Analytics becomes all that more important to enable utilities to transform digitally. Although the level of maturity varies, the importance of data-driven business decision-making has been well acknowledged and somewhat supported across the utility industry. The Big Data challenges manifest in the process of developing a data strategy, coined by the characteristics of 3V – Volume, Variety, Velocity and then expanded to 5V, 7V, and the latest 10V. With the advent of industrial 4.0, the amount of data collected by utilities will only grow as more and more IIoT devices are deployed. Utilities are struggling to figure out how to effectively leverage the data. Turning data into actionable insights is a key challenge for utility leaders. Data strategy development could be time-consuming, and the heavy lifting is mostly building a list of prioritized business cases that truly deliver value. This research report provides utility leaders with a repository of pre-curated utility data analytics use cases and a filtering and prioritization framework. This approach can help fast-track the process of identifying the right business problems to solve strategically. |

Executive Summary
Your ChallengeYour organization recognizes the importance of building a business-driven data strategy to enable digital transformation. You are having difficulty in:
|
Common Obstacles
|
Info-Tech’s Approach
|
Info-Tech Insight
Demonstrating the return on investment (ROI) of data analytics programs is vital to digitally transforming your organization. Empower data-driven decision-making by leveraging Info-Tech's approach to accelerate the process and take advantage of your community.
Data analytics is a key enabler for digital transformation
| Utilities today are facing unprecedented challenges that are categorized into the Trifecta of Change in the Info-Tech Future of Utilities Strategic Foresight Report.
Digitally transforming the utility business to strengthen its business capabilities is key to building its resilience. Proactive plans to address the external disruptions and internal interruptions call on actions to enhance foundational technology capabilities. Digitalization accelerates the risks; expanding attack surfaces. The enablement of an advanced data analytics platform to support data-driven digital utilities is the foundational step necessary to support any core business transformation initiatives. Predicted 11.28% CAGR growth (2022-2027) |
 |
Data challenges for utilities are elevated during digital transformation
| How to process rapid generation?
Existing systems such as billing application is not effective in handling the fast generated data such as the interval data from smart meters. How to develop actionable insights?Collecting data is useless unless you turn it into business insights to deliver value. How to synergize data consistently?Data that is collected from different sources have disparate meaning and types. For example, a utility customer could mean different things for different departments. [tdwi, 2017; IOP Conf.Ser.:Mter.Sci.Eng, 2020; IJOIR, 2021] |
 |
How to handle the exponential growth?
Number of IIoT devices and field sensors are collecting unprecedented amounts of data. On-premise data storage becomes costly and not elastic enough. How to harvest different data, integrated?Utilities are collecting varied data, both internal operational data and external data, but often siloed. How to gain trust of data quality?Quality of data could be measured in many ways such as accuracy, timeliness, and completeness, but the effort to track is often insurmountable. How to present data meaningfully?The same set of raw data can be presented in many ways. Effective and meaningful storytelling can drive decision making. |

About Info-Tech
Info-Tech Research Group is the world’s fastest-growing information technology research and advisory company, proudly serving over 30,000 IT professionals.
We produce unbiased and highly relevant research to help CIOs and IT leaders make strategic, timely, and well-informed decisions. We partner closely with IT teams to provide everything they need, from actionable tools to analyst guidance, ensuring they deliver measurable results for their organizations.
What Is a Blueprint?
A blueprint is designed to be a roadmap, containing a methodology and the tools and templates you need to solve your IT problems.
Each blueprint can be accompanied by a Guided Implementation that provides you access to our world-class analysts to help you get through the project.
Talk to an Analyst
Our analyst calls are focused on helping our members use the research we produce, and our experts will guide you to successful project completion.
Book an Analyst Call on This Topic
You can start as early as tomorrow morning. Our analysts will explain the process during your first call.
Get Advice From a Subject Matter Expert
Each call will focus on explaining the material and helping you to plan your project, interpret and analyze the results of each project step, and set the direction for your next project step.
Unlock Sample ResearchContributors
- Gaudy Jandron, VP of IT, Energy United Electric Membership Corporation
- Loic Barancourt, CCO, UnaBiz